MASTERCLASS
Dashboarding for impact with R Shiny
Is it getting harder to keep up with your data and confidently publish data visualisations?
Keen to branch out from Excel, or are you currently using out of the box tools such as Tableau or Power BI that leave you frustrated?
Struggling to get your app off the ground by yourself?
Used AI to generate a cool concept but aren’t sure how to progress it further and run it securely?
If any of this sounds familiar, this Masterclass might just be what you need!
This Masterclass is delivered in collaboration with Murdoch University and the Harry Butler Institute.
Registration for this Masterclass is now closed.
If you are interested in being notified about the next events in our Masterclass Series, please register interest.
Why this workshop?
R Shiny dashboards are a game-changer for effective and highly customisable data visualisation of everything from simple research and sampling outputs to highly dynamic and complex datasets.
R is the most popular language in the world of data science, it's highly versatile and the standard language for performing statistical operations. R is an open-source language (which means you don’t have to pay a license fee to use it). Even better, R provides you with the ability to build aesthetic web-applications.
Using the R Shiny package, you can quickly and easily develop and deploy visually striking, interactive web-based dashboards to tell better stories with your data – while also taking advantage of feature-rich R packages to power your visualisations. You can also customise the look, feel and function of your dashboard to your heart’s content; from one of Shiny’s pre-made layouts or from scratch, using CSS and JavaScript to super-charge your app.
While artificial intelligence tools are becoming increasingly effective at generating prototypes and concepts, advancing these outputs into long-last products that drive organisational change (AI-assisted or not) is made substantially easier when you understand how the underlying tools work and know what to include in your prompt. Learn how to use R Shiny for your next data visualisation project and get insights into what R Shiny is capable of.
We will take you in a structured and time-efficient way through what you need to know and will cover e.g. R Shiny capabilities, design approaches, coding essentials best practices and how to publish your newly created app. Case studies will be used to provide applied examples of R Shiny apps in action. Finally, we will explore some of the cutting-edge approaches being used to embed artificial intelligence to empower your applications.
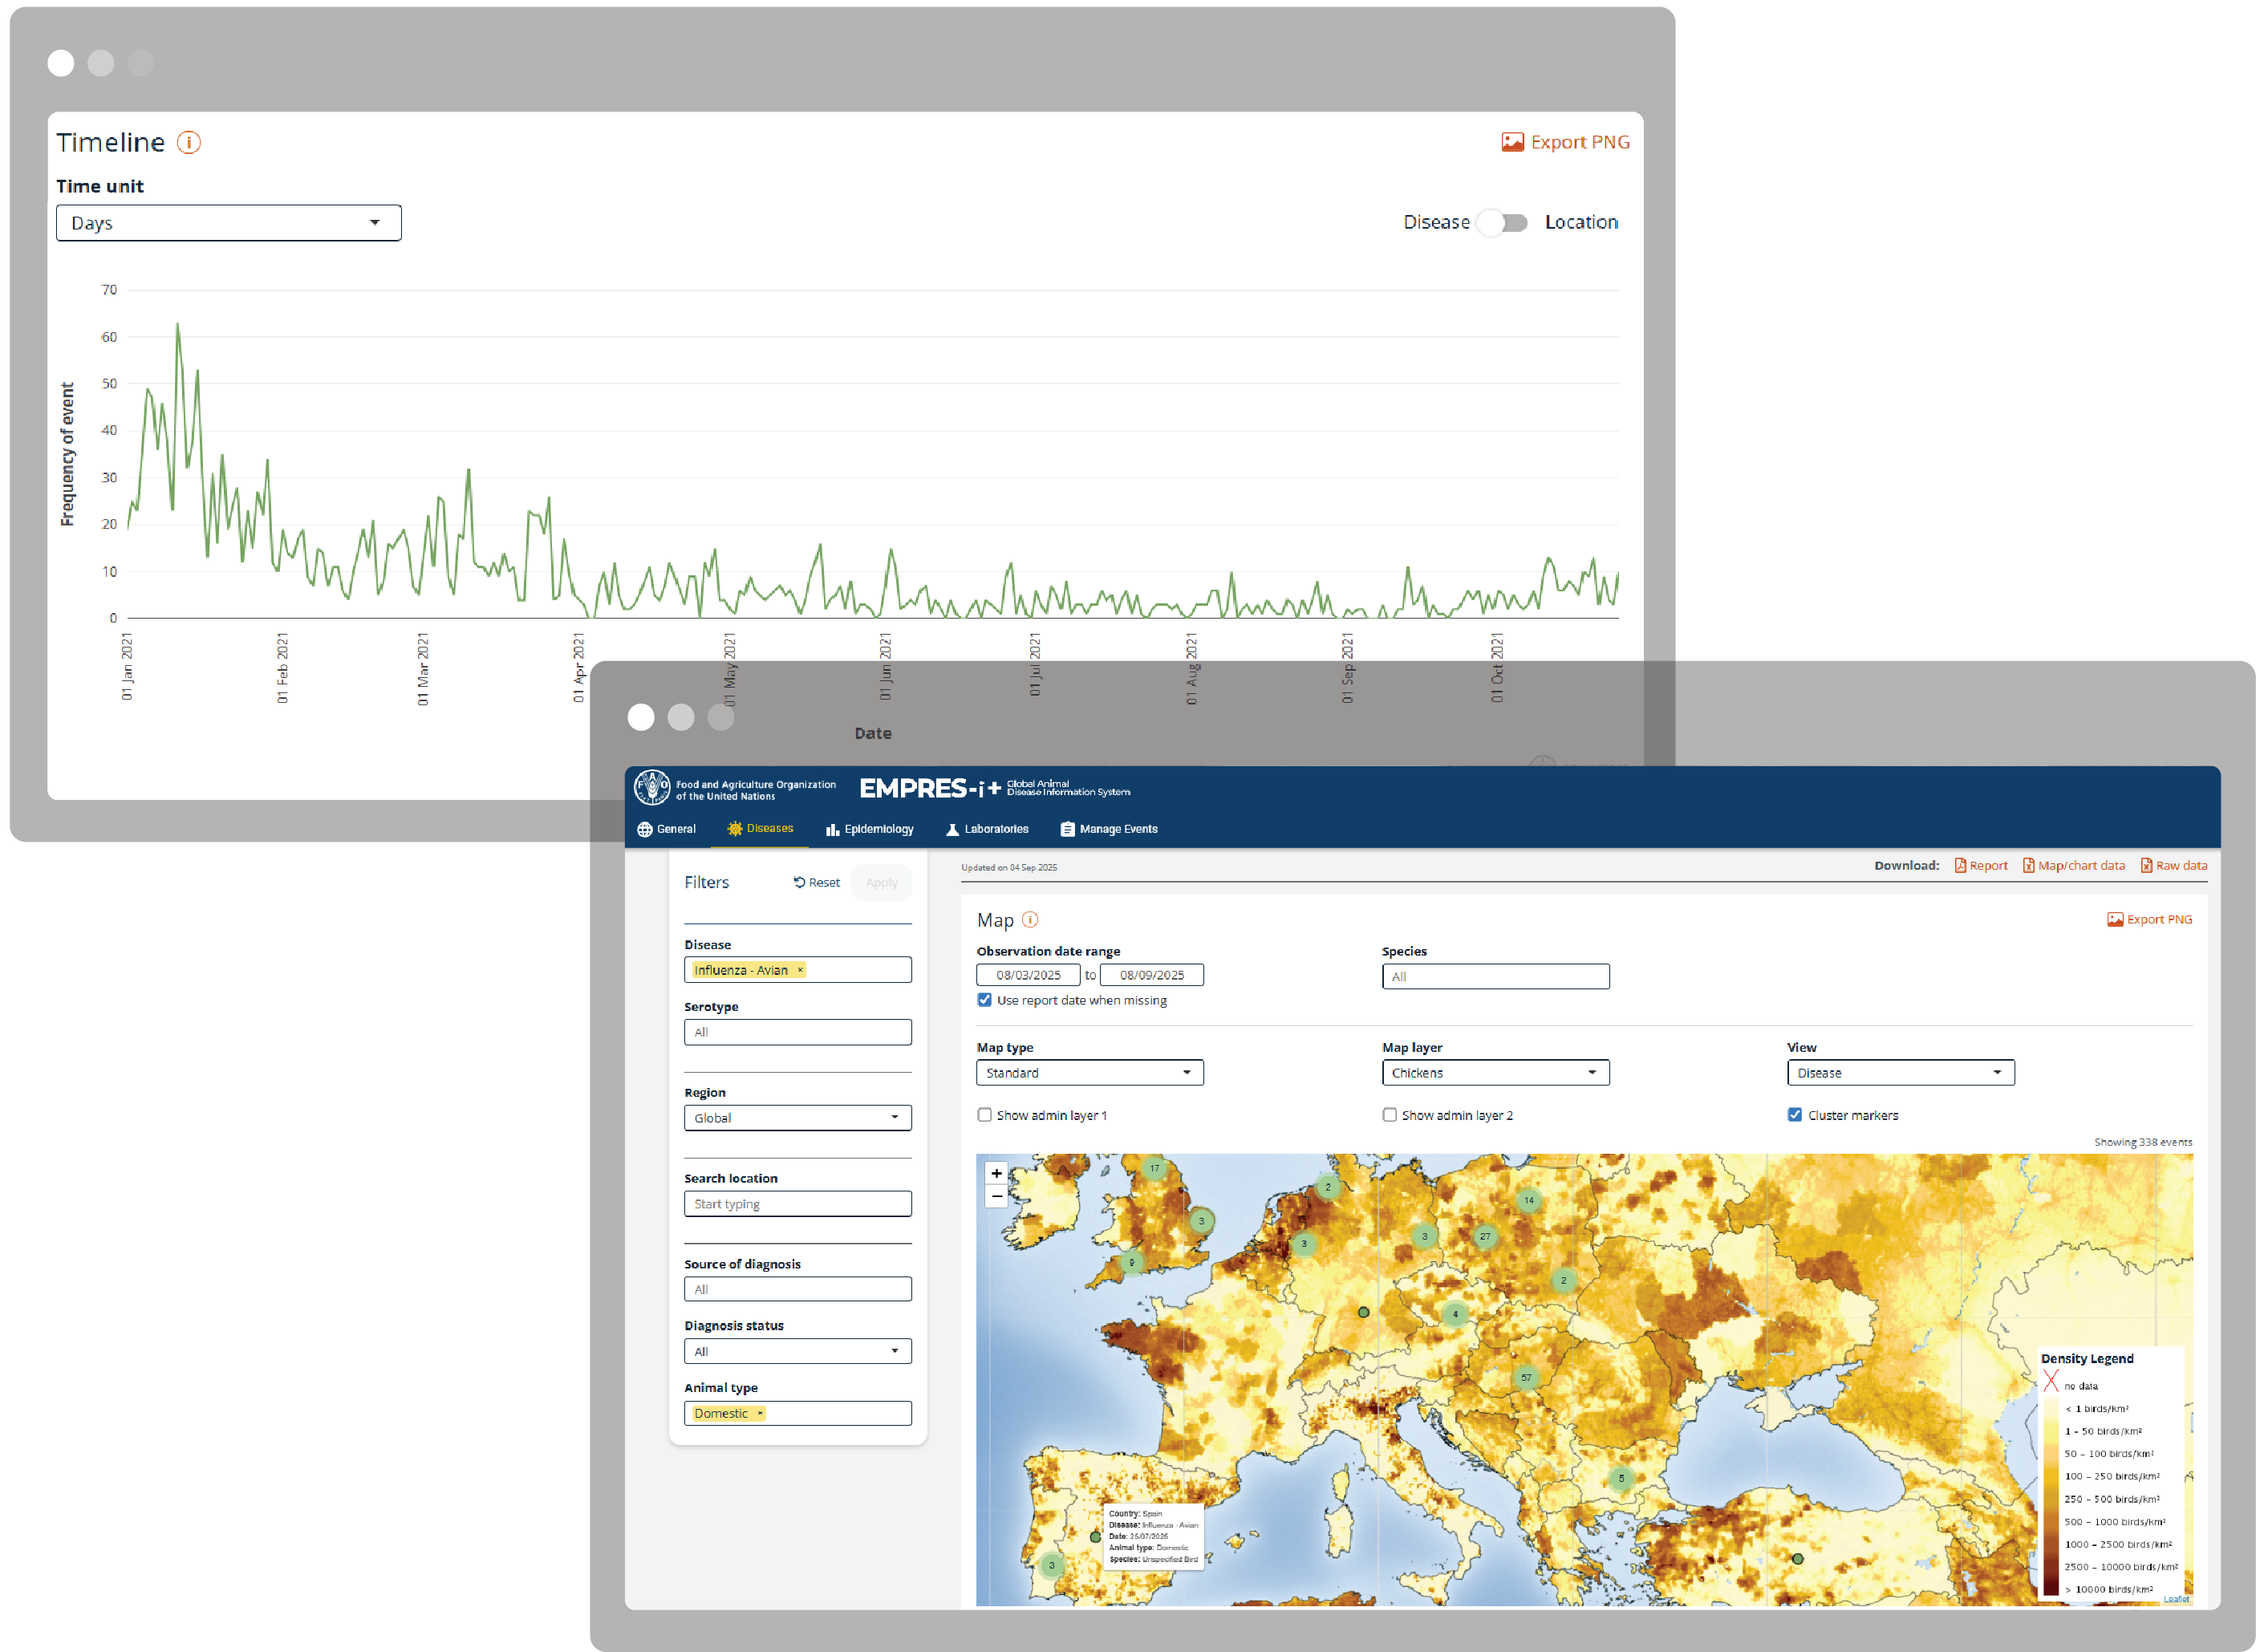
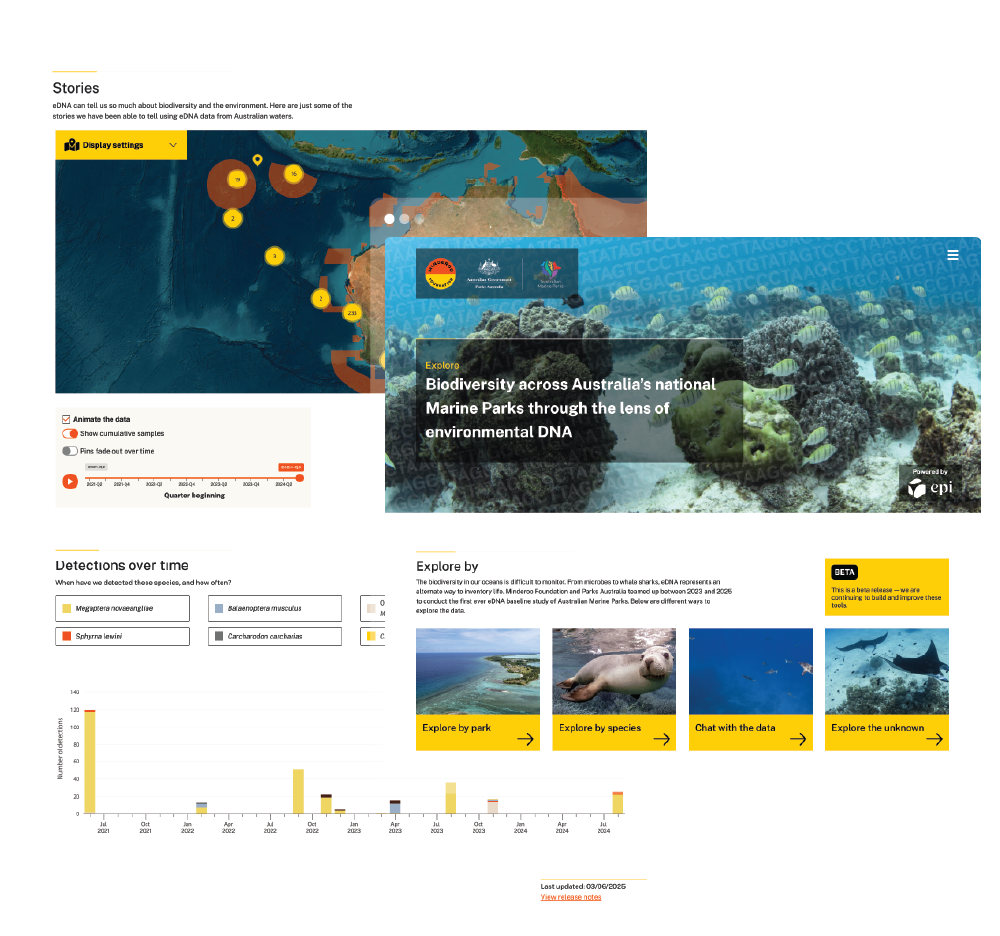
Check out the examples on our work page to see what is possible with R Shiny.
Is this class for me?
The numbers speak for themselves.
Established in 2018, our Masterclasses and trainings have been completed by hundreds of participants joining us from 20+ countries. The training is highly interactive, delivered in small groups, enhanced by an online learning platform with active support provided throughout by our team.
All our trainings are supported by qualified software developers and interface design experts trained under our partnership with Posit to bring best practice to participants; whatever their background.
Learning objectives
By the end of this Masterclass participants will:
- Be familiar with RStudio Cloud and understand the structure of a Shiny application
- Be able to construct an interface in Shiny and add interactive elements
- Understand the concept of reactivity in Shiny for connecting the user with the code
- Be able to use reactivity to process and display data based on user inputs
- Be able to include more complex visualisations of data in their applications
- Know the R package options available to embed artificial intelligence into dashboards and their requirements
- Be mindful of best practice and be aware of challenges that commonly occur when scaling apps from prototypes into routinely used decision support tools
- Know how to publish your Shiny applications to the web
- Have a set of tools and techniques to use for debugging and development of a Shiny app
Prerequisites
Basic R programming skills; we can provide online learning resources prior to the Masterclass if you haven’t used R before, would like a refresh or are unsure if you have the required knowledge.
Some experience with HTML & CSS would be beneficial; however, it is not mandatory.
No subscriptions or accounts with an AI service provider are required.
Here's what our participants say
The R Shiny Masterclass Series was essential for us to set the foundations that led to the development of an interactive report on use of antimicrobial in dairy production in Quebec, Canada. It covered many of the most important Shiny R features and helped us a lot to pick the best approach. We got hooked and we are thus already working on our next app! We feel Shiny is an awesome way to make complex data and fancy epi work digestible and appealing for stakeholders.
Prof Simon Dufour, Université de Montréal, Canada
Epi’s R Shiny Masterclass is a great introduction to advanced-level concepts in Shiny. I’d recommend it to anyone who feels like they know the basics of building a dashboard in Shiny and want to know, “What’s next?”
Jan-Yves Ruzicka, Ministry of Business, Innovation and Employment (MBIE), New Zealand
The advanced Shiny Masterclass lived up to (even exceeded) our hopes. Colleagues and I found the sessions well structured, not too lengthy, with a good balance between content and breakout sessions, and practically oriented. Best of all, the exercises to do between sessions were well designed for us to hone our skills. Managing it all on RStudio Cloud was a genius move.
Dr Paddy Tobias, Social Research Centre Australia, Australia
Instructor
Kiel Hards
Data Science Lead | Epi
Kiel is a senior data scientist who builds cloud-native analytics pipelines and applies generative AI to real-time intelligence challenges. He has delivered national threat-monitoring platforms, automated global information feeds, and prototyped LLM-powered recommenders that surface critical insights faster. Backed by 45 + peer-reviewed publications and stewardship of multi-million-dollar research programmes, he combines scientific rigour with production engineering across Python, R and SQL.

Keen to network and learn from others that are using open source tools?
Check out R Exchange Perth
14–15 October 2026