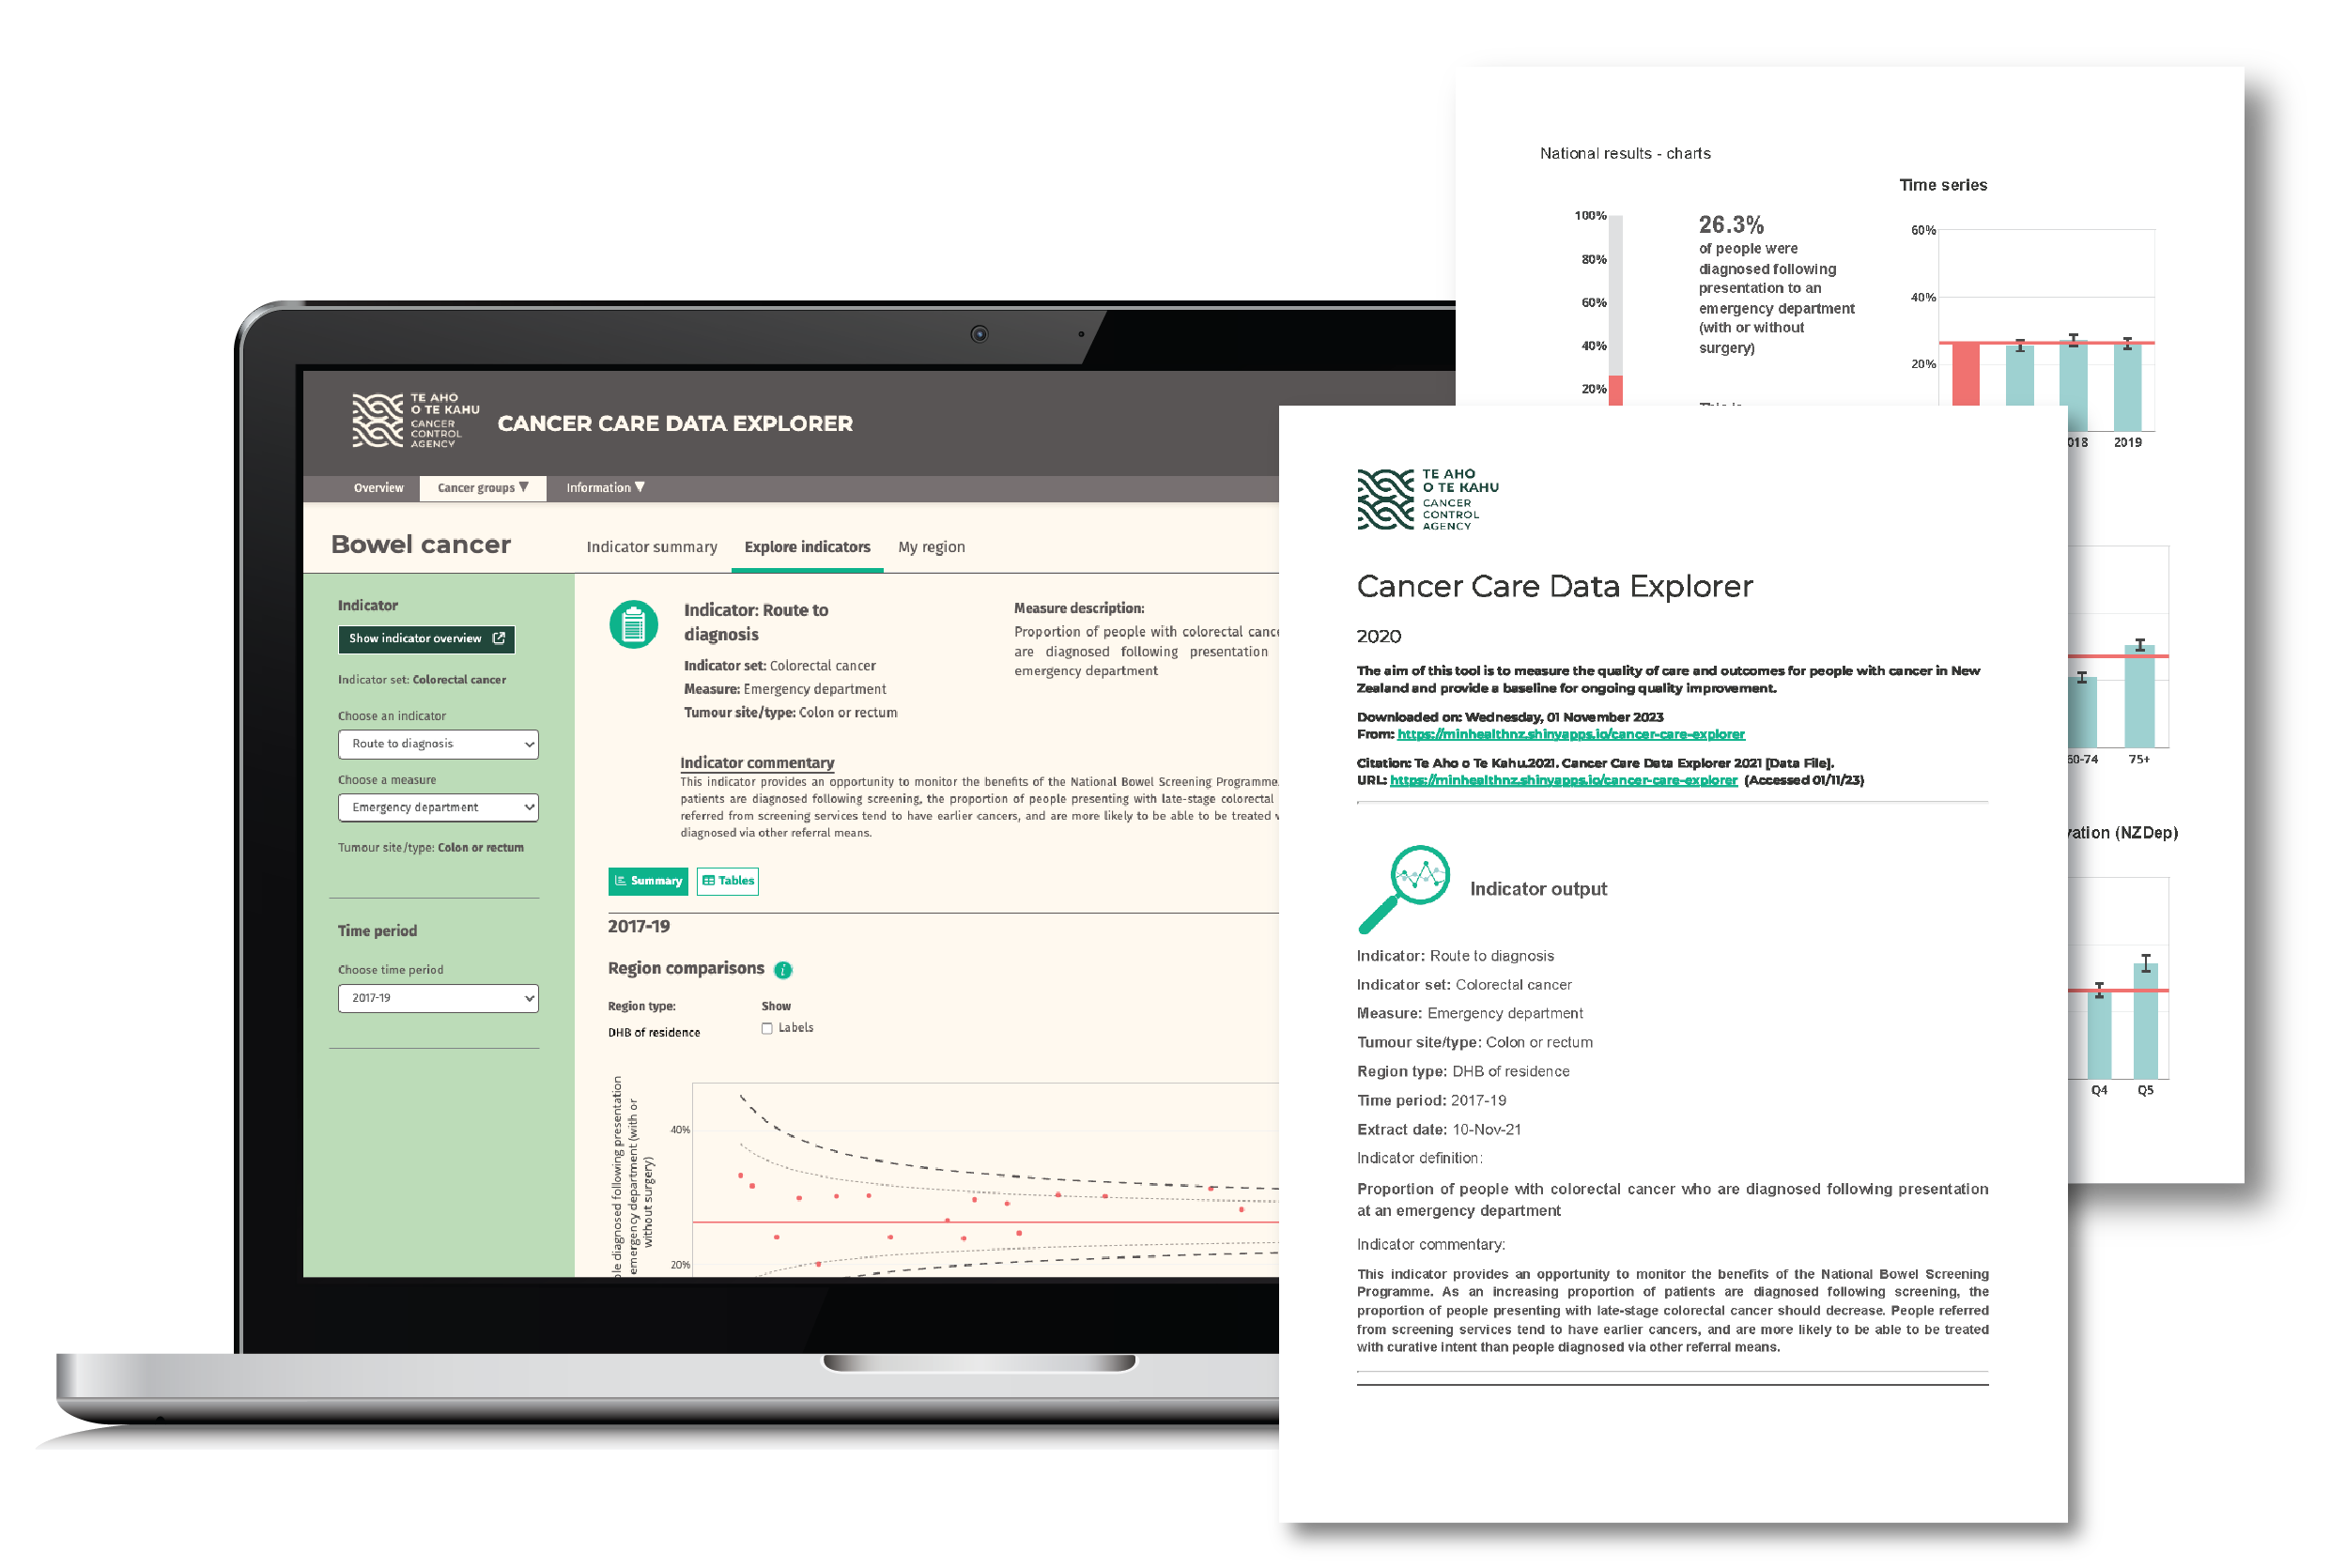
MASTERCLASS
Automated Reporting with Quarto
Are you working with R or Python for your data analytics, but find yourself lacking a good way to share insights and communicate data? Do you need a solution which allows you to automatically generate up-to-date scientific and technical reports and presentations? If so, then Quarto, the latest open-source reporting framework from Posit, might be right up your alley!
Open group classes aren’t quite right for you?
Sounds like custom workshops for your organization or individual coaching might be the way to go.
WHEN
10–19 February 2026
4 interactive sessions, 90 minutes each, incl. hands-on coding and assignments in between sessions
WHERE
Online Masterclass
PRICE
$1550 NZD excl. gst
Numbers are limited, register now to reserve your place.
10% discount for attendees of previous Masterclasses
Why Quarto?
Quarto is one of Posit’s latest multi-language reporting offerings. Having been rigorously developed by the team at Posit as the ‘successor’ to R Markdown, the framework offers full backwards compatibility with the original features of R Markdown, along with new features such as language support for Python and Julia, formats such as RevealJS presentations, HTML, PDF, Microsoft Word, even website and ebook formats! You can even use Quarto documents as an environment for your data science experimentation, thanks to the multi-language integration which allows you to run code directly from the Quarto document itself.
The framework also uses a rich Markdown syntax to provide access to powerful technical and scientific notations such as equations, citations, figures, cross-references, advanced layouts and more. Quarto documents can easily be automated and published to online services such as Posit Connect or Confluence whenever your data changes.
You can be sure that your Quarto documents will be fully reproducible, easily extendable with insightful visualisations, and easily shared and updated to communicate your findings to the decision makers who need them most.
Join our “Automated Reporting with Quarto” Masterclass and learn how to harness the power of Quarto, to dynamically create and share high quality reports and presentations, fit these reports into your existing R or Python workflow and have all your favourite analytics built straight in!

Is this the class for me?
The numbers speak for themselves.
Established in 2018, our Masterclasses and trainings have been completed by over 230 participants from 90 organisations joining from 20 countries. The training is highly interactive, delivered in small groups, enhanced by an online learning platform with active support provided throughout by our team.
All our trainings are supported by fully qualified software engineers and interface design experts trained under our partnership with Posit to bring best practice to participants; whatever their background.
Here's what our participants say
The R Shiny Masterclass Series was essential for us to set the foundations that led to the development of an interactive report on use of antimicrobial in dairy production in Quebec, Canada. It covered many of the most important Shiny R features and helped us a lot to pick the best approach. We got hooked and we are thus already working on our next app! We feel Shiny is an awesome way to make complex data and fancy epi work digestible and appealing for stakeholders.
Simon Dufour, Université de Montréal, Canada
Epi’s R Shiny Masterclass is a great introduction to advanced-level concepts in Shiny. I’d recommend it to anyone who feels like they know the basics of building a dashboard in Shiny and want to know, “What’s next?”
Jan-Yves Ruzicka, Ministry of Business, Innovation and Employment (MBIE), New Zealand
The advanced Shiny masterclass lived up to (even exceeded) our hopes. Colleagues and I found the sessions well structured, not too lengthy, with a good balance between content and breakout sessions, and practically-oriented. Best of all, the exercises to do between sessions were well designed for us to hone our skills. Managing it all on RStudio Cloud was a genius move.
Paddy Tobias, Social Research Centre Australia, Australia
Instructors

Nick Snellgrove
Tech Lead | Epi
Nick leads Epi’s dashboard engineering team, guiding standards and mentoring developers to ship fast, reliable data applications. Beyond his well‑known R and Shiny expertise, he has hands‑on experience with Python workflows, relational databases, Docker and AWS, enabling him to deploy interactive data tools that scale securely in the cloud. He shares best practice through Epi’s annual Shiny Masterclass.

Kiel Hards
Senior Data Scientist | Epi
Kiel is a senior data scientist who builds cloud-native analytics pipelines and applies generative AI to real-time intelligence challenges. He has delivered national threat-monitoring platforms, automated global information feeds, and prototyped LLM-powered recommenders that surface critical insights faster. Backed by 45 + peer-reviewed publications and stewardship of multi-million-dollar research programmes, he combines scientific rigour with production engineering across Python, R and SQL.
Learning objectives
- Understand the structure of a Quarto document and how each part fits together
- Learn how to use Markdown rich text formatting
- Create static, structured content (E.g. text, images, links, tables) in a Quarto document
- Embed R / Python code and dynamic code chunks into a Quarto document to auto generate content
- Know how to tailor a Quarto document towards PDF / HTML / Word document outputs
- Learn to modularise and parameterise a Quarto document for easy re-use and dynamic reports
- Explore other available output types, such as RevealJS presentations
- Publish a feature complete Quarto report to Quarto Pub

Schedule
Session start times
- New Zealand (NZDT) 9am
- Sydney (AEST) 7am
Day before:
- Paris (CEST) 9pm
- London (BST) 8pm
- Toronto (EDT) 3pm
- Los Angeles (PDT) 12pm
Session dates
10, 12, 17, 19, February 2026
Each session is 90 min long (online Zoom tutorial). We also recommend putting some time aside in-between the sessions to work on assignments and to practice in your own time, ideally at least one hour. A detailed schedule will be provided after registration.