Automating the reporting of indicators of national significance
The New Zealand Ministry for Cities, Environment, Regions & Transport (MCERT) supports the utilisation of national eDNA datasets that provide valuable information on biodiversity, ecosystem health and biosecurity. To make the information within the data set accessible raw eDNA data needs to be translated into consistent, interpretable indicators that offer practical value and can be widely shared with stakeholders.
An automated and reproducible way to generate indicators
The Ministry needed a practical, repeatable way to apply agreed eDNA metrics across existing national datasets. The growth of eDNA datasets has made it critical to automate the generation of indicator results. Making the process reproducible and interoperable so insights gained can be widely shared and operationalised.
Driven by a community of experts
Working with technical teams across the public sector and sequencing service providers, we developed open-source workflows to automatically generate consistent technical indicators, such as the Taxonomy Independent Community Index (TICI). Outputs are clearly documented, allowing them to be updated and reused as datasets, and reporting needs, evolve.
Creating accessible and reusable data products
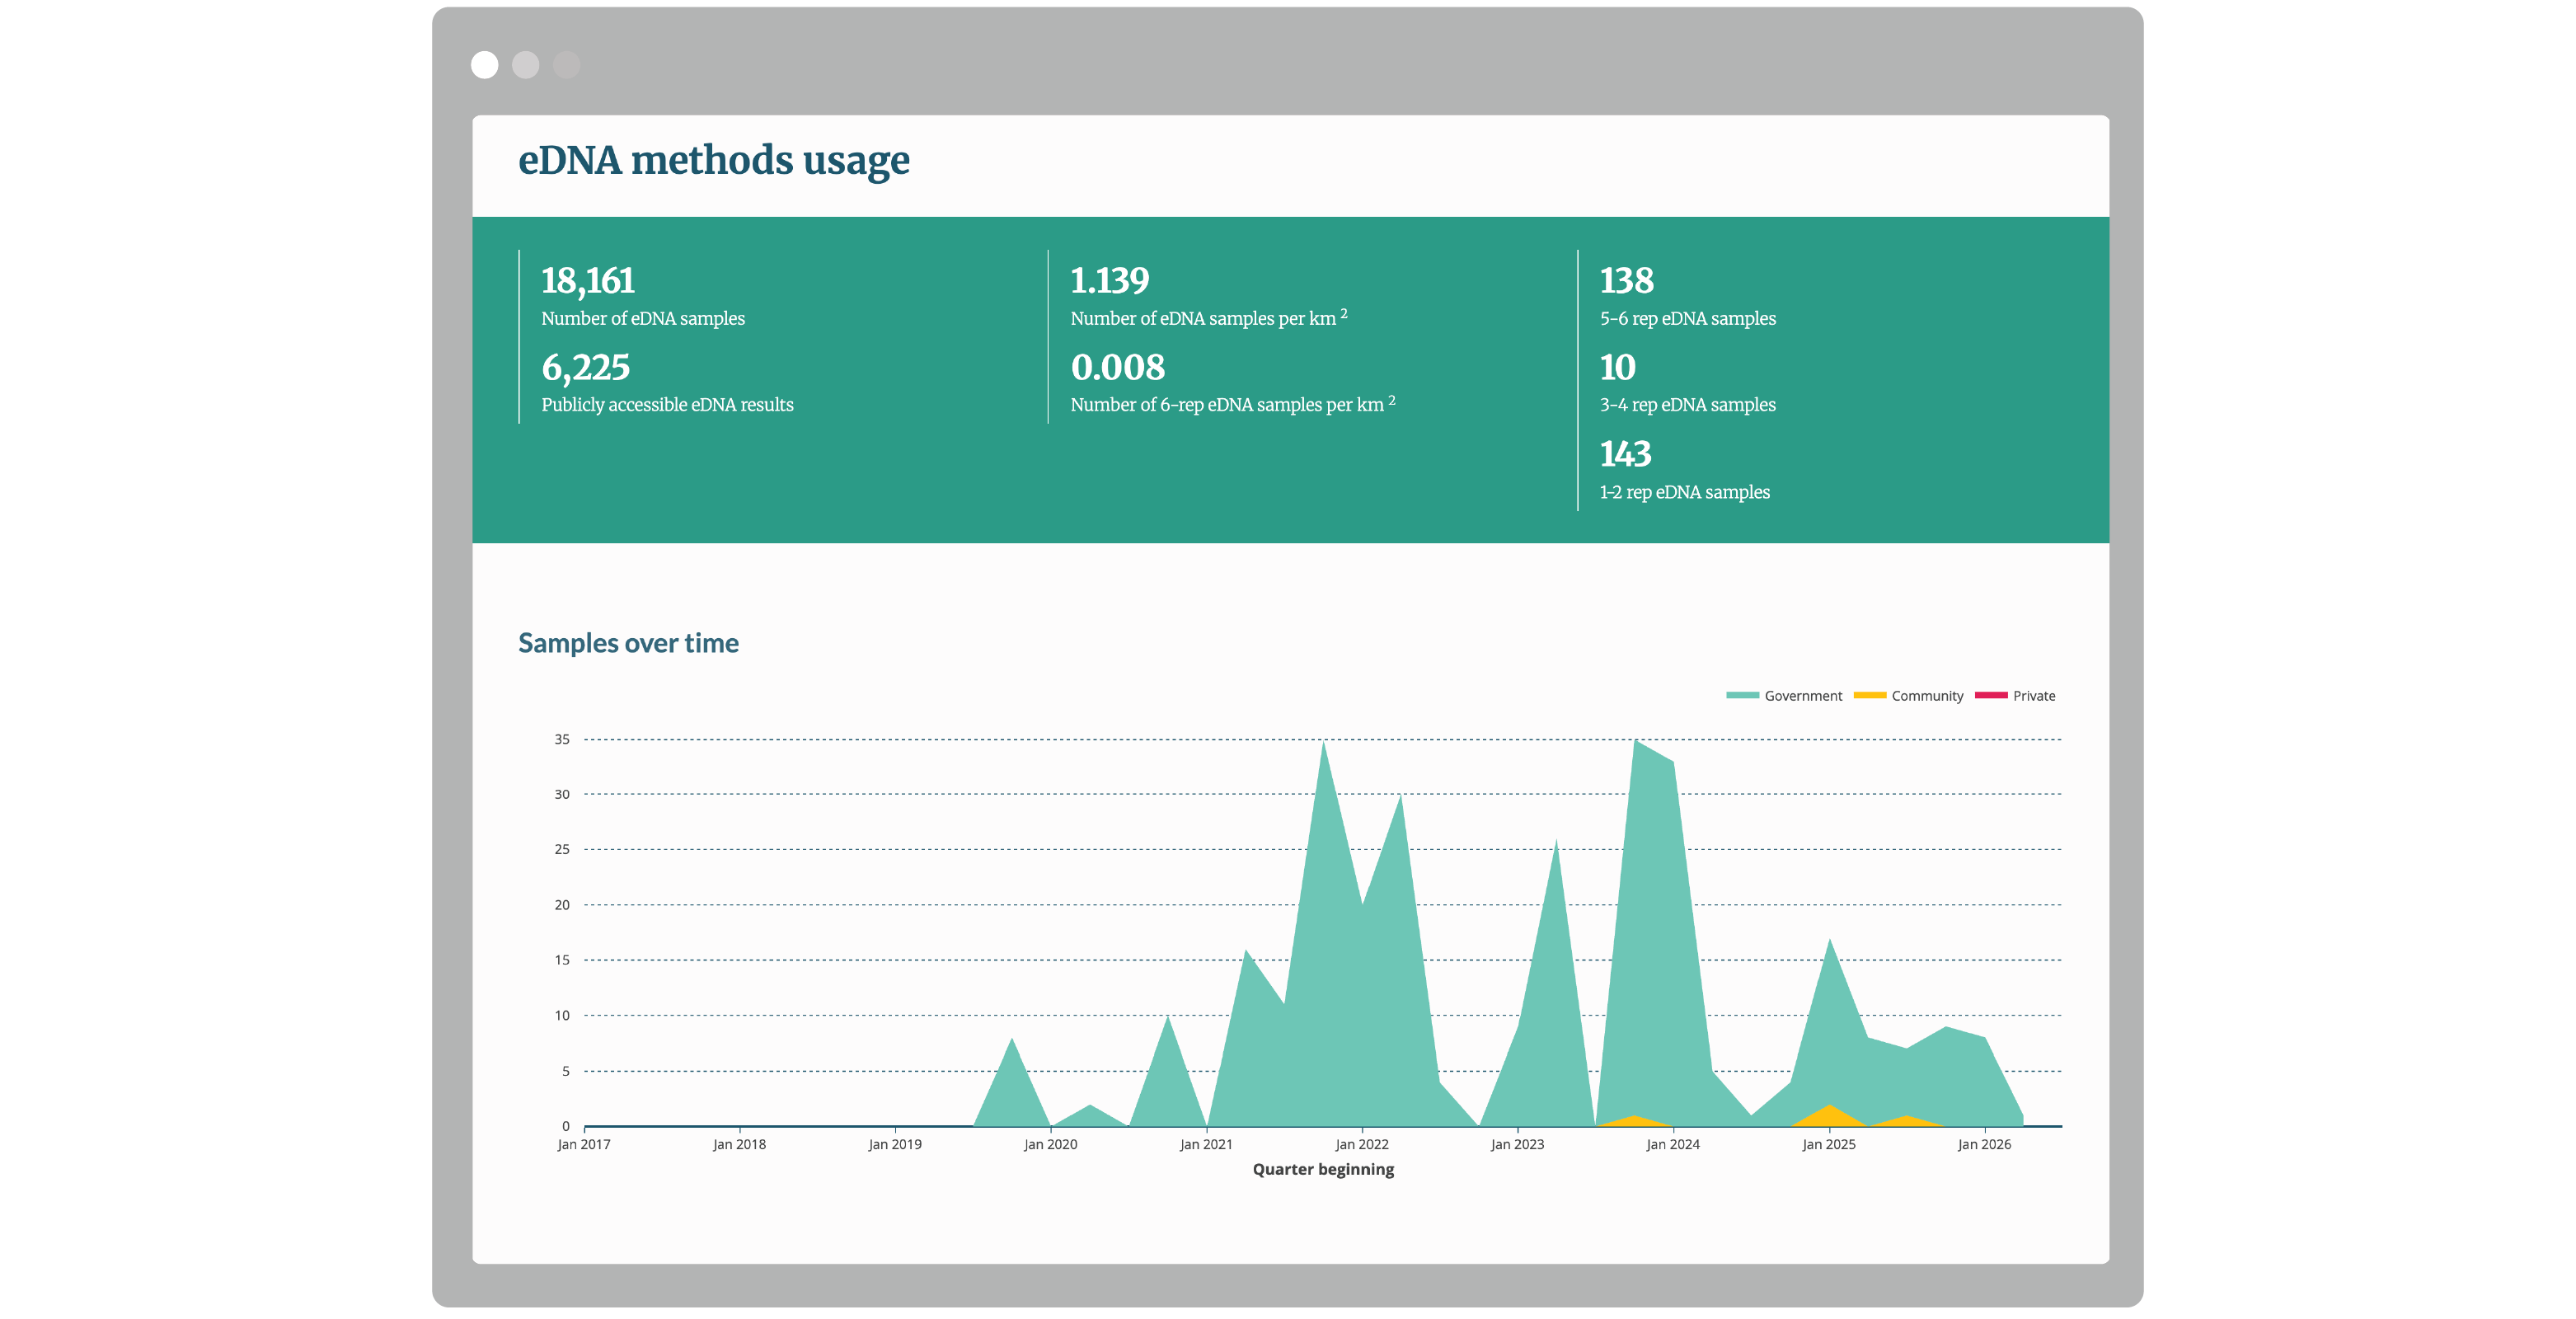
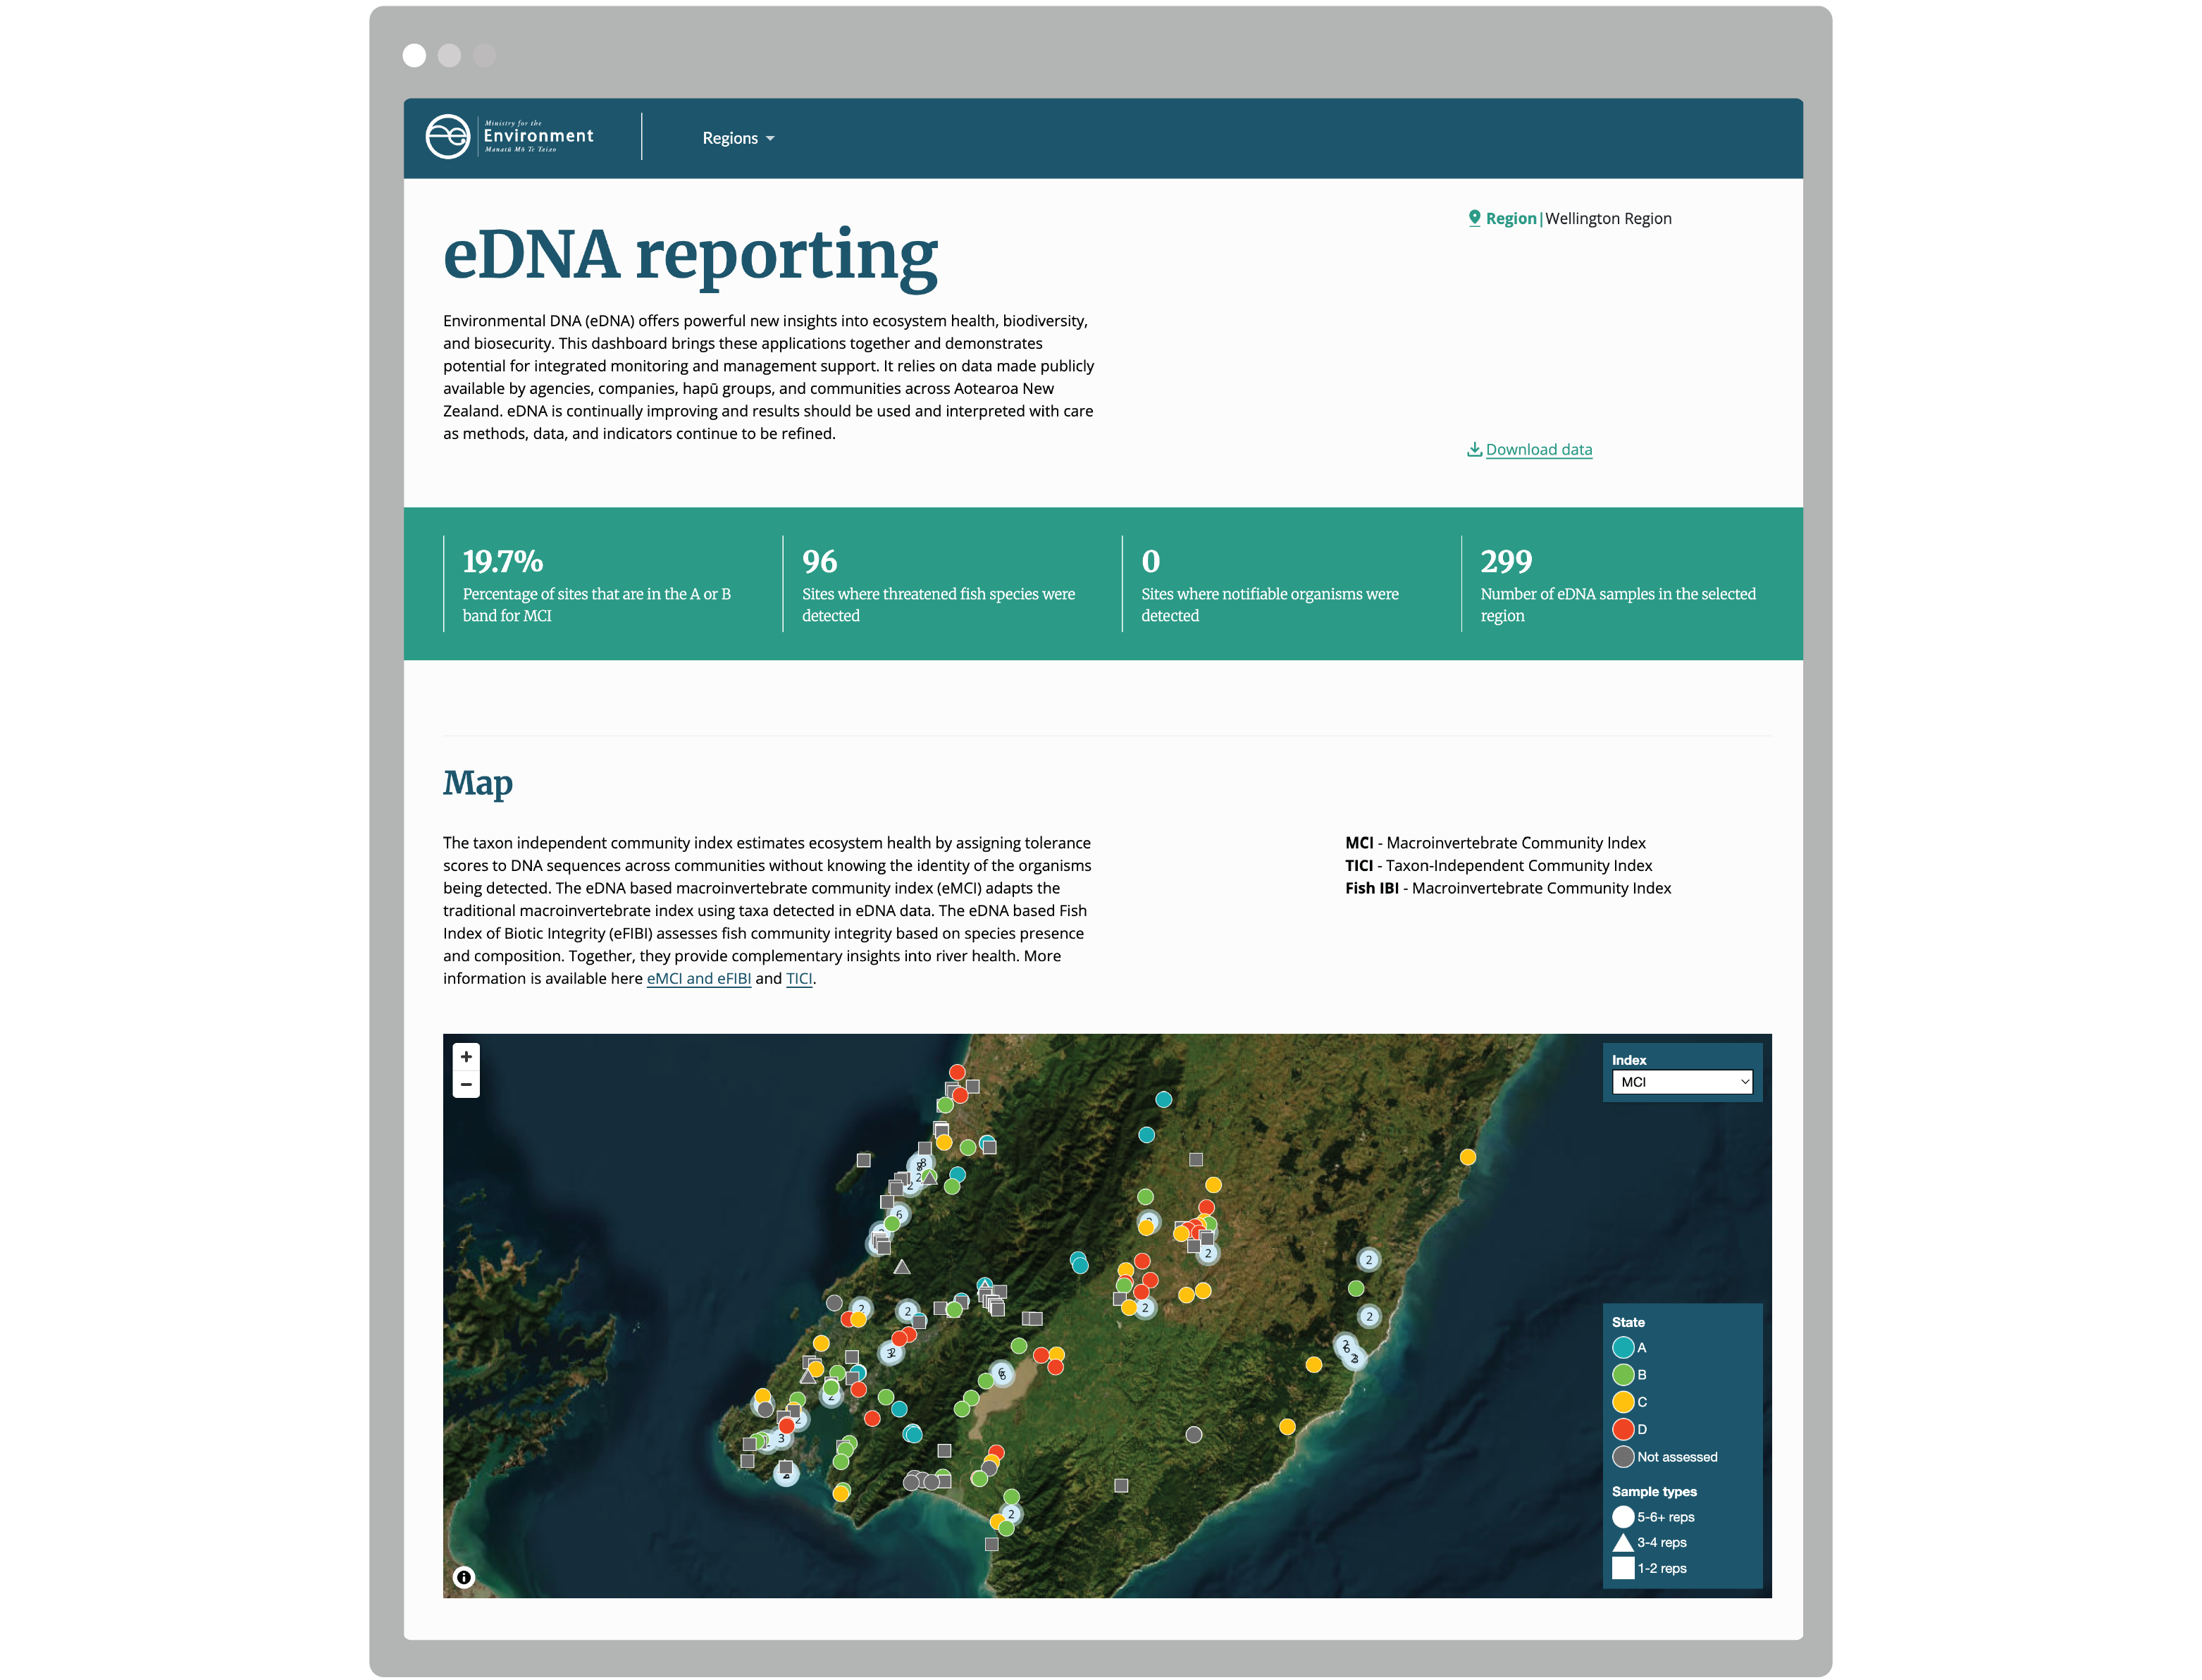
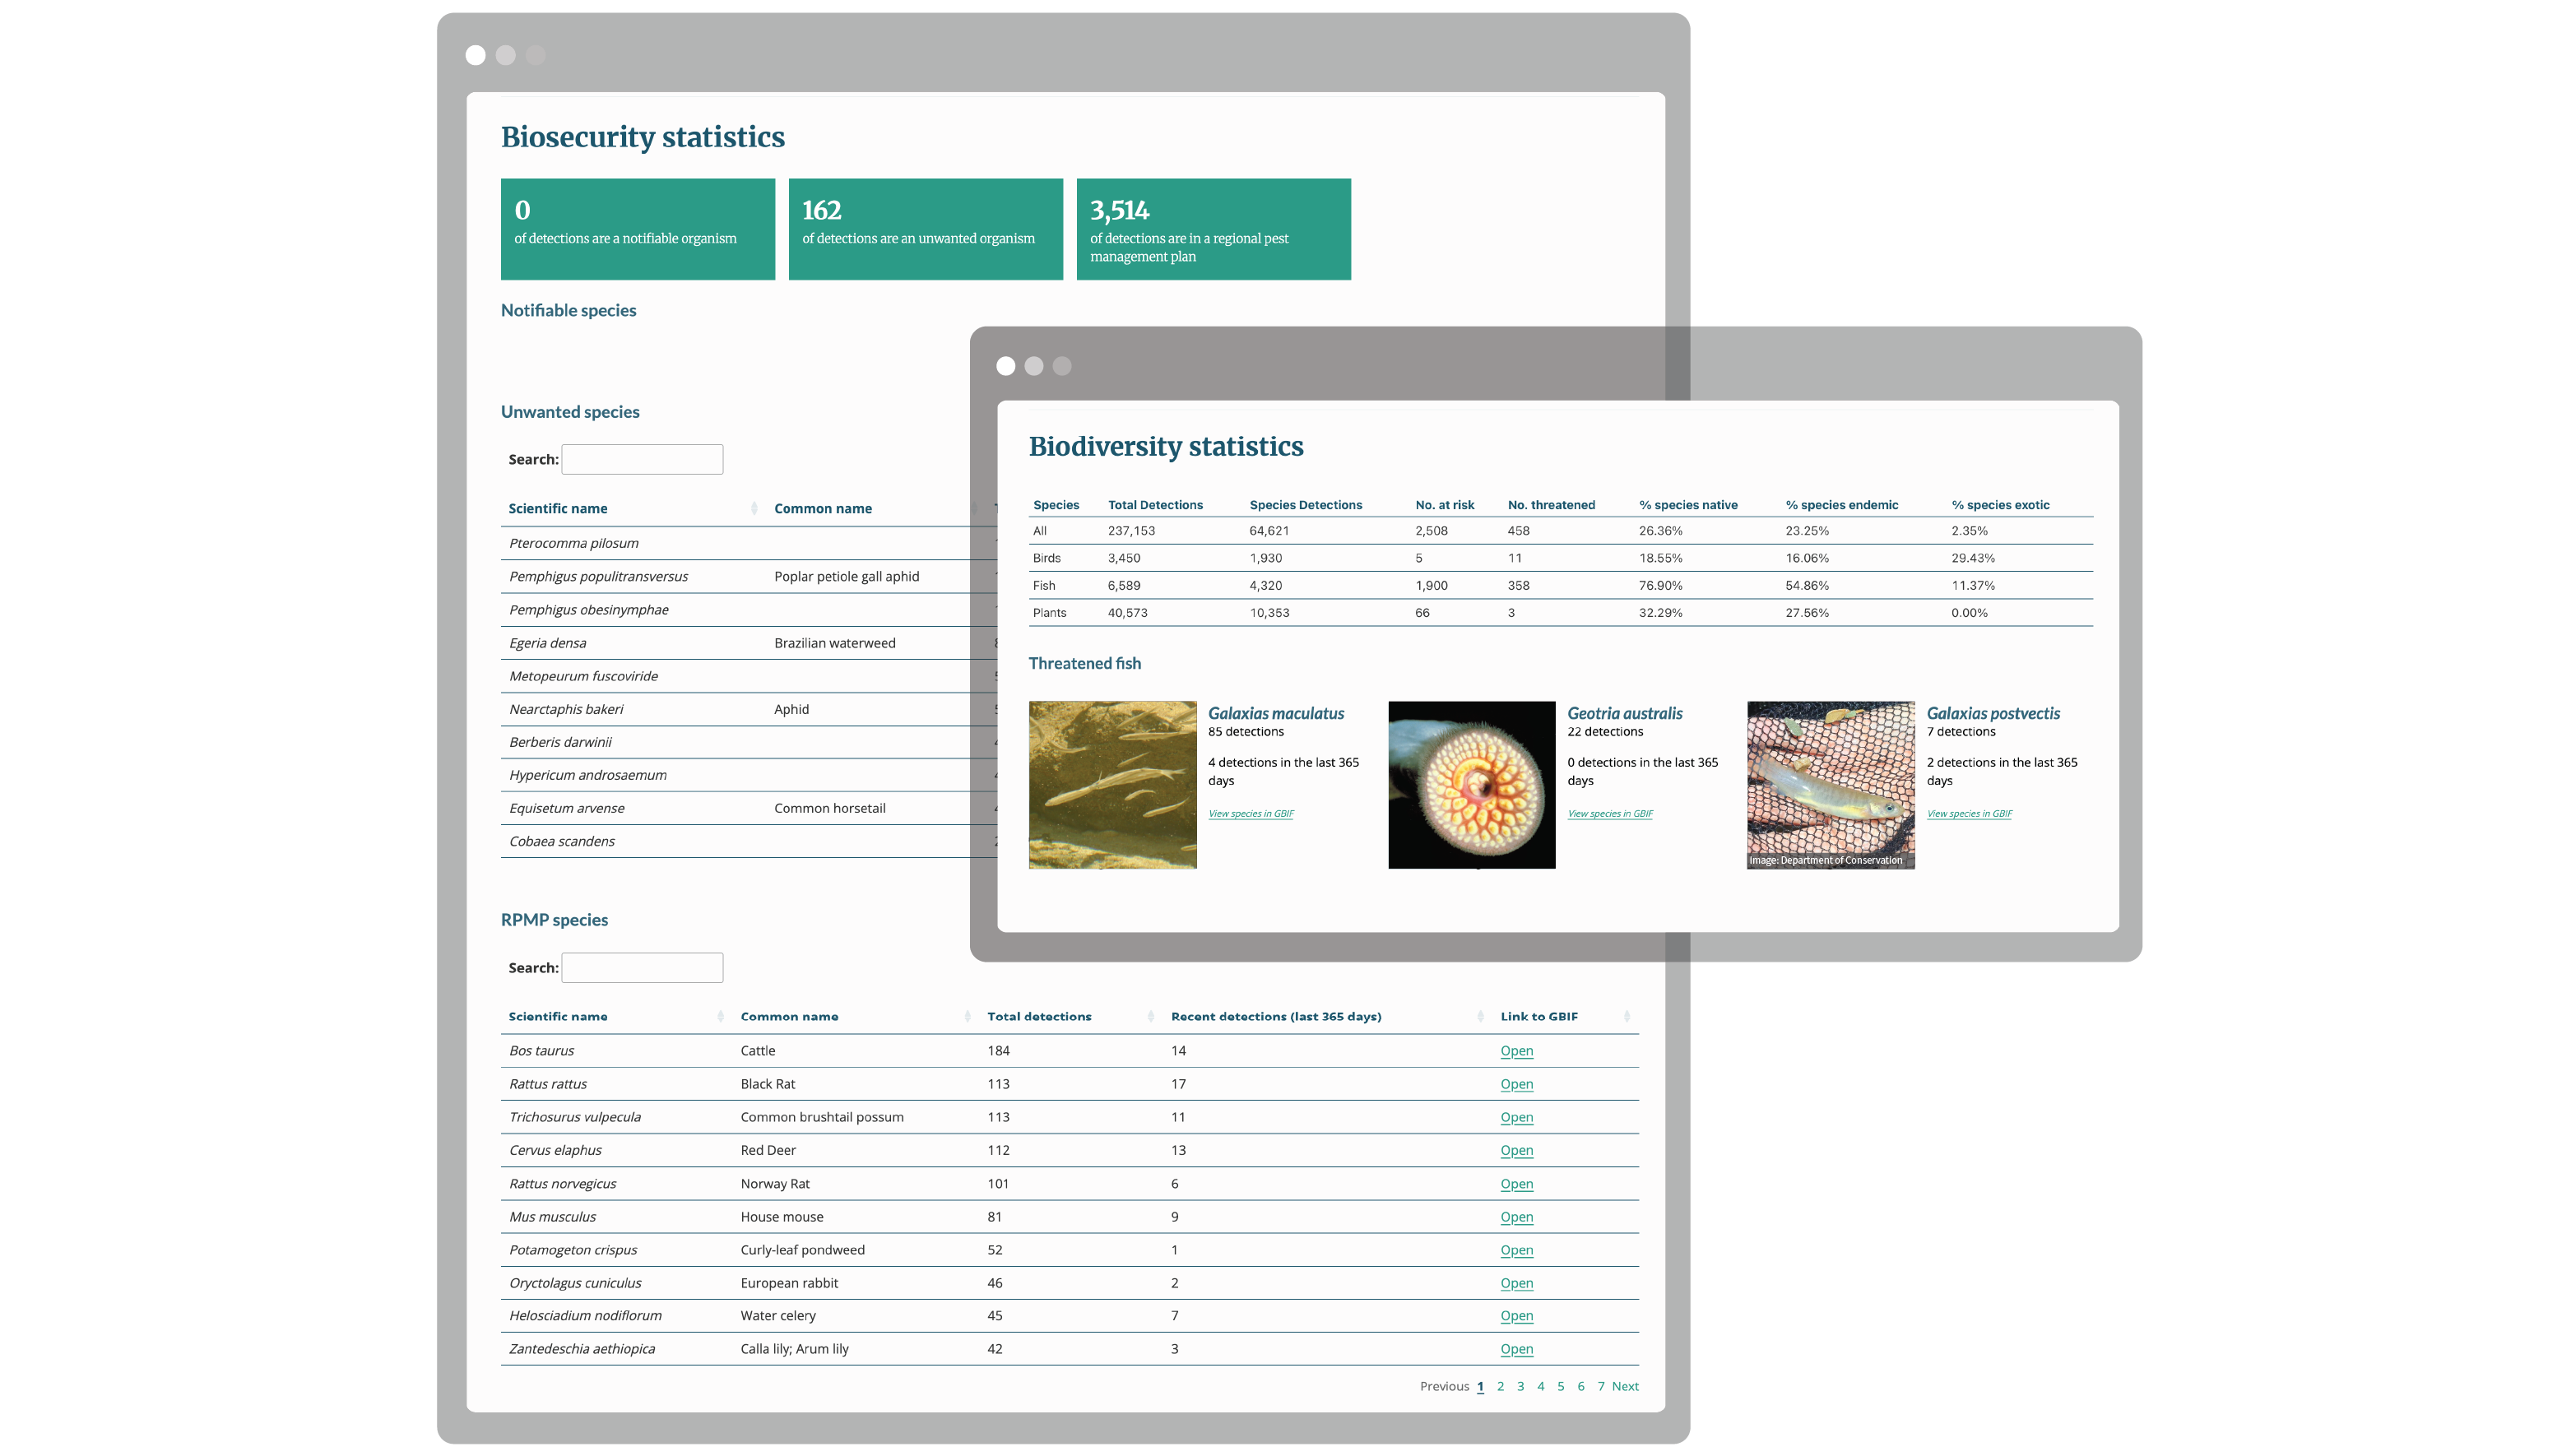
A reusable reporting system was created using R scripts and Quarto reports that present indicator results in a consistent way through maps, charts and tables. Two forms of outputs are available – interactive web-based HTML reports and interoperable spatial data sets. The reports provide a structured way to explore eDNA finding such as endangered species detections or indicators of stream health, while underlying spatial datasets can easily be exported separately to reuse and integration in other systems and platforms.
Enabling consistent updates and broader use
Through this project MCERT and its community of stakeholders now have access to a reproducible framework for generating and presenting eDNA indicators without the need to re-build the analysis each time. Documented scripts and reusable spatial outputs provide version control and allow the wide sharing and use of the data generated.
An open-source approach built for future updates
The solution was built using open-source R and the Quarto authoring framework (Posit’s next generation version of R Markdown). We created documented scripts that generate agreed indicators and publishes them as web-based HTML reports with maps, charts, tables and interactivity. Spatial outputs can be exported in reusable formats, giving the Ministry flexibility to update the reports or integrate results into other analytical and mapping tools.