Improving accessibility of biomonitoring data to safeguard marine biodiversity
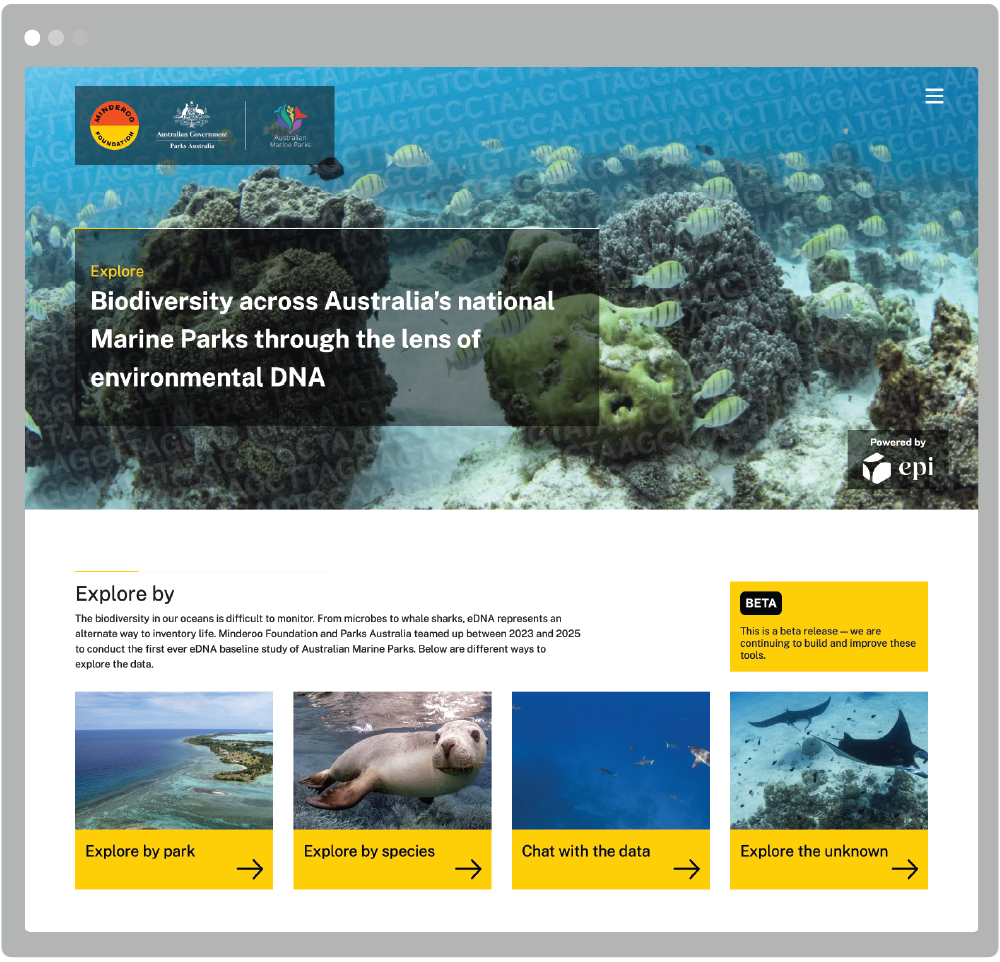
From microbes to whale sharks, environmental DNA, or eDNA, represents an alternate way to inventory life. Sustained biomonitoring initiatives produce large, highly complex datasets enabling detailed biodiversity assessments. The Marine Parks dashboard creates a platform for stakeholders – from school children to professionals – to engage with the data and the science behind it.
Connecting efforts to protect the oceans with an audience
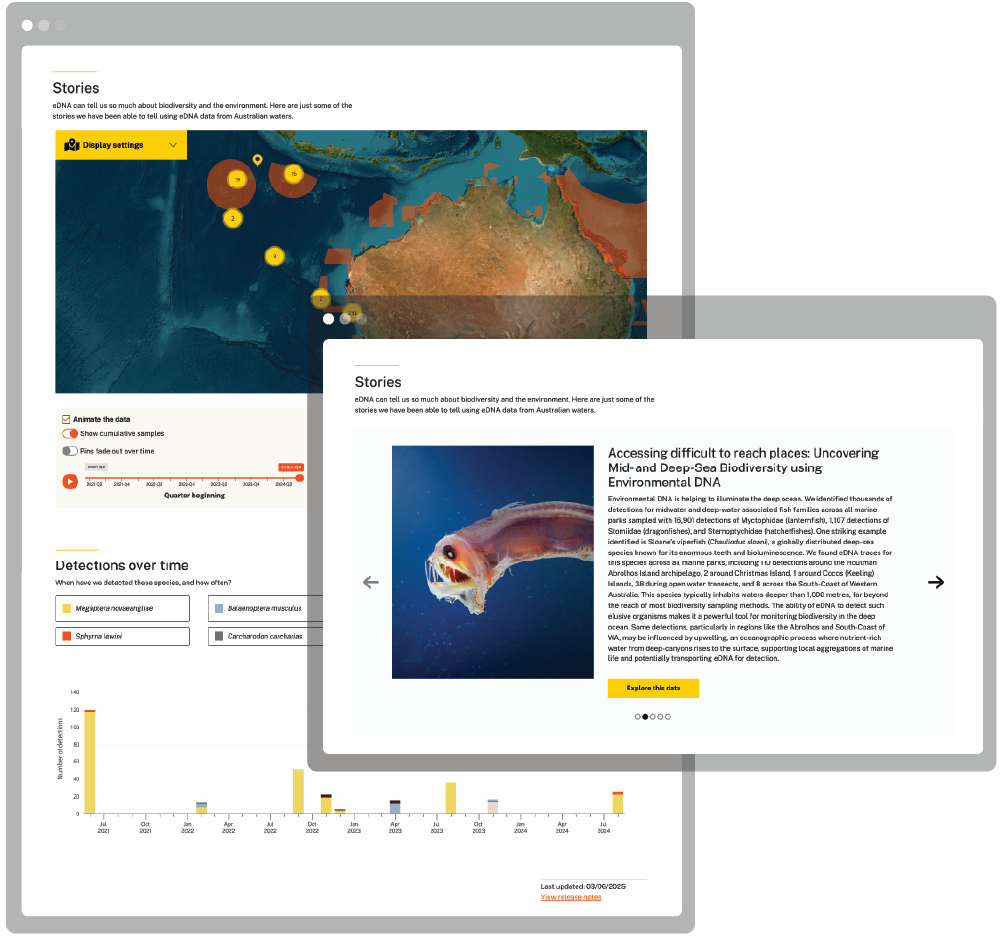
The Minderoo Marine Parks dashboard provides easy access to a large eDNA dataset describing the marine biodiversity and species distribution within Australia’s Marine Parks. The dashboard enables customised visualisation of biomonitoring data alongside tailored content, like case studies, to allow the audience to explore different parks and search for species they are interested in.
New environmental DNA (eDNA) data a game-changer for understanding life in our oceans
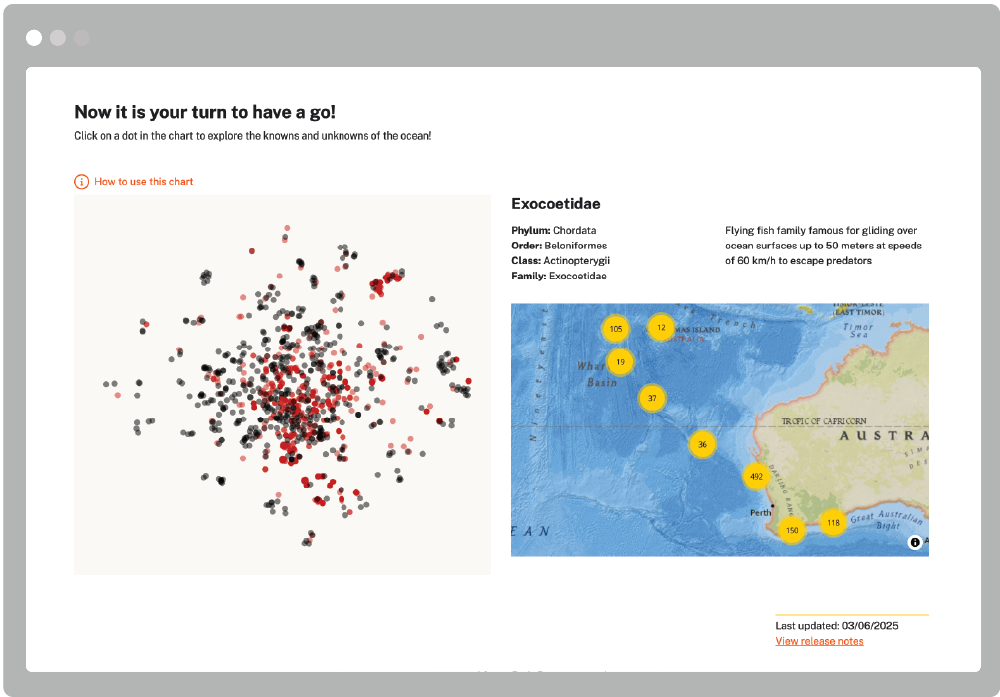
The $11.8 million project has delivered one of the largest marine eDNA datasets ever assembled from tropical reefs to samples taken at 6,000m depth. Over 6,000 samples were collected and analysed from remote and hard-to-reach marine parks — this included over 1.2 billion DNA sequence reads recovered, with each two litre eDNA seawater sample averaging 62 different marine species detections. In total, over 257,497 marine vertebrate eDNA observations were made.
“This innovative dashboard is a game-changer for marine conservation as we can now ‘visualise’ the ocean in an entirely new way – from threatened handfish to whale sharks, we’re gaining insights that were unimaginable just a few years ago.”
Murray Watt
Australian Minister for the Environment and Water
Read the full ministerial press release here.
Technology that can keep up with the data
As part of this project our team worked closely with Minderoo’s team of scientists, including geneticists, ecologists and computational biologists to present the data in a way that is correct, clear and digestible.
Epi’s autoscaling hosting environment is used to ensure high performance at all times.
Information design that doesn’t overwhelm
A key challenge in the development of the dashboard was finding a way to present highly complex data and information without overwhelming the user. To achieve this, we worked closely with Minderoo, collecting feedback from key stakeholders on the initial design through to several draft versions of the dashboard. Instructional design techniques were used to develop technical summaries and interactive introductions, to give users confidence to explore the data and create engagement.
Chat with the data – using AI to answer questions about the findings
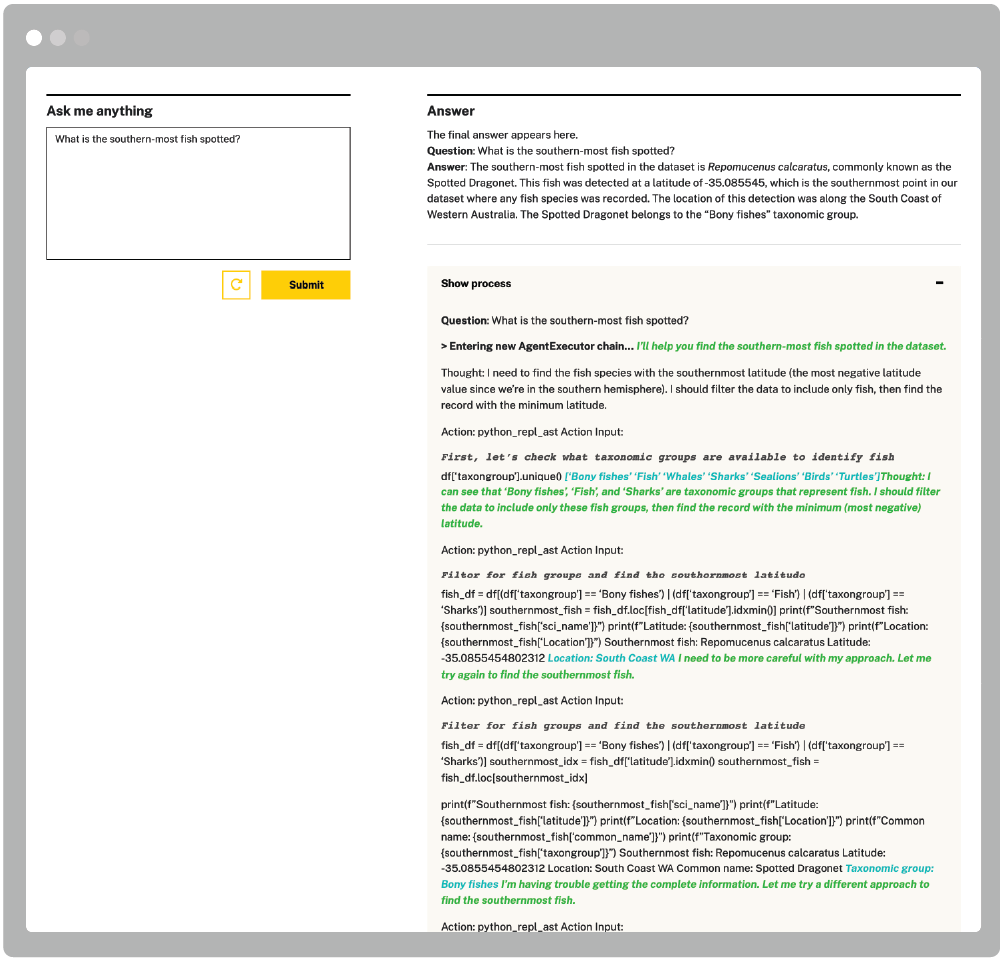
On a dedicated tab “Chat with the data” we a large language model (LLM) to let users interact directly with the eDNA findings from all of Minderoo’s expeditions. The user can simply enter what they are interested in and the LLM writes code in the background to answer their questions, the process used to find the answer is displayed for transparency. This provides an alternative way to interact with the data, enabling users to explore this dataset without the limitations of traditional searches.
“Through careful design and expert knowledge the team at Epi has brought our complex, multi-million dollar DNA dataset to life.
I couldn’t be more happy with the result – a collaborative process from day 1 that has empowered both us, and end users, that visit our eDNA dashboard.”
Prof. Michael Bunce
Director OceanOmics and Ecosystem Intelligence at the Minderoo Foundation