Empowering the transition to clean energy use
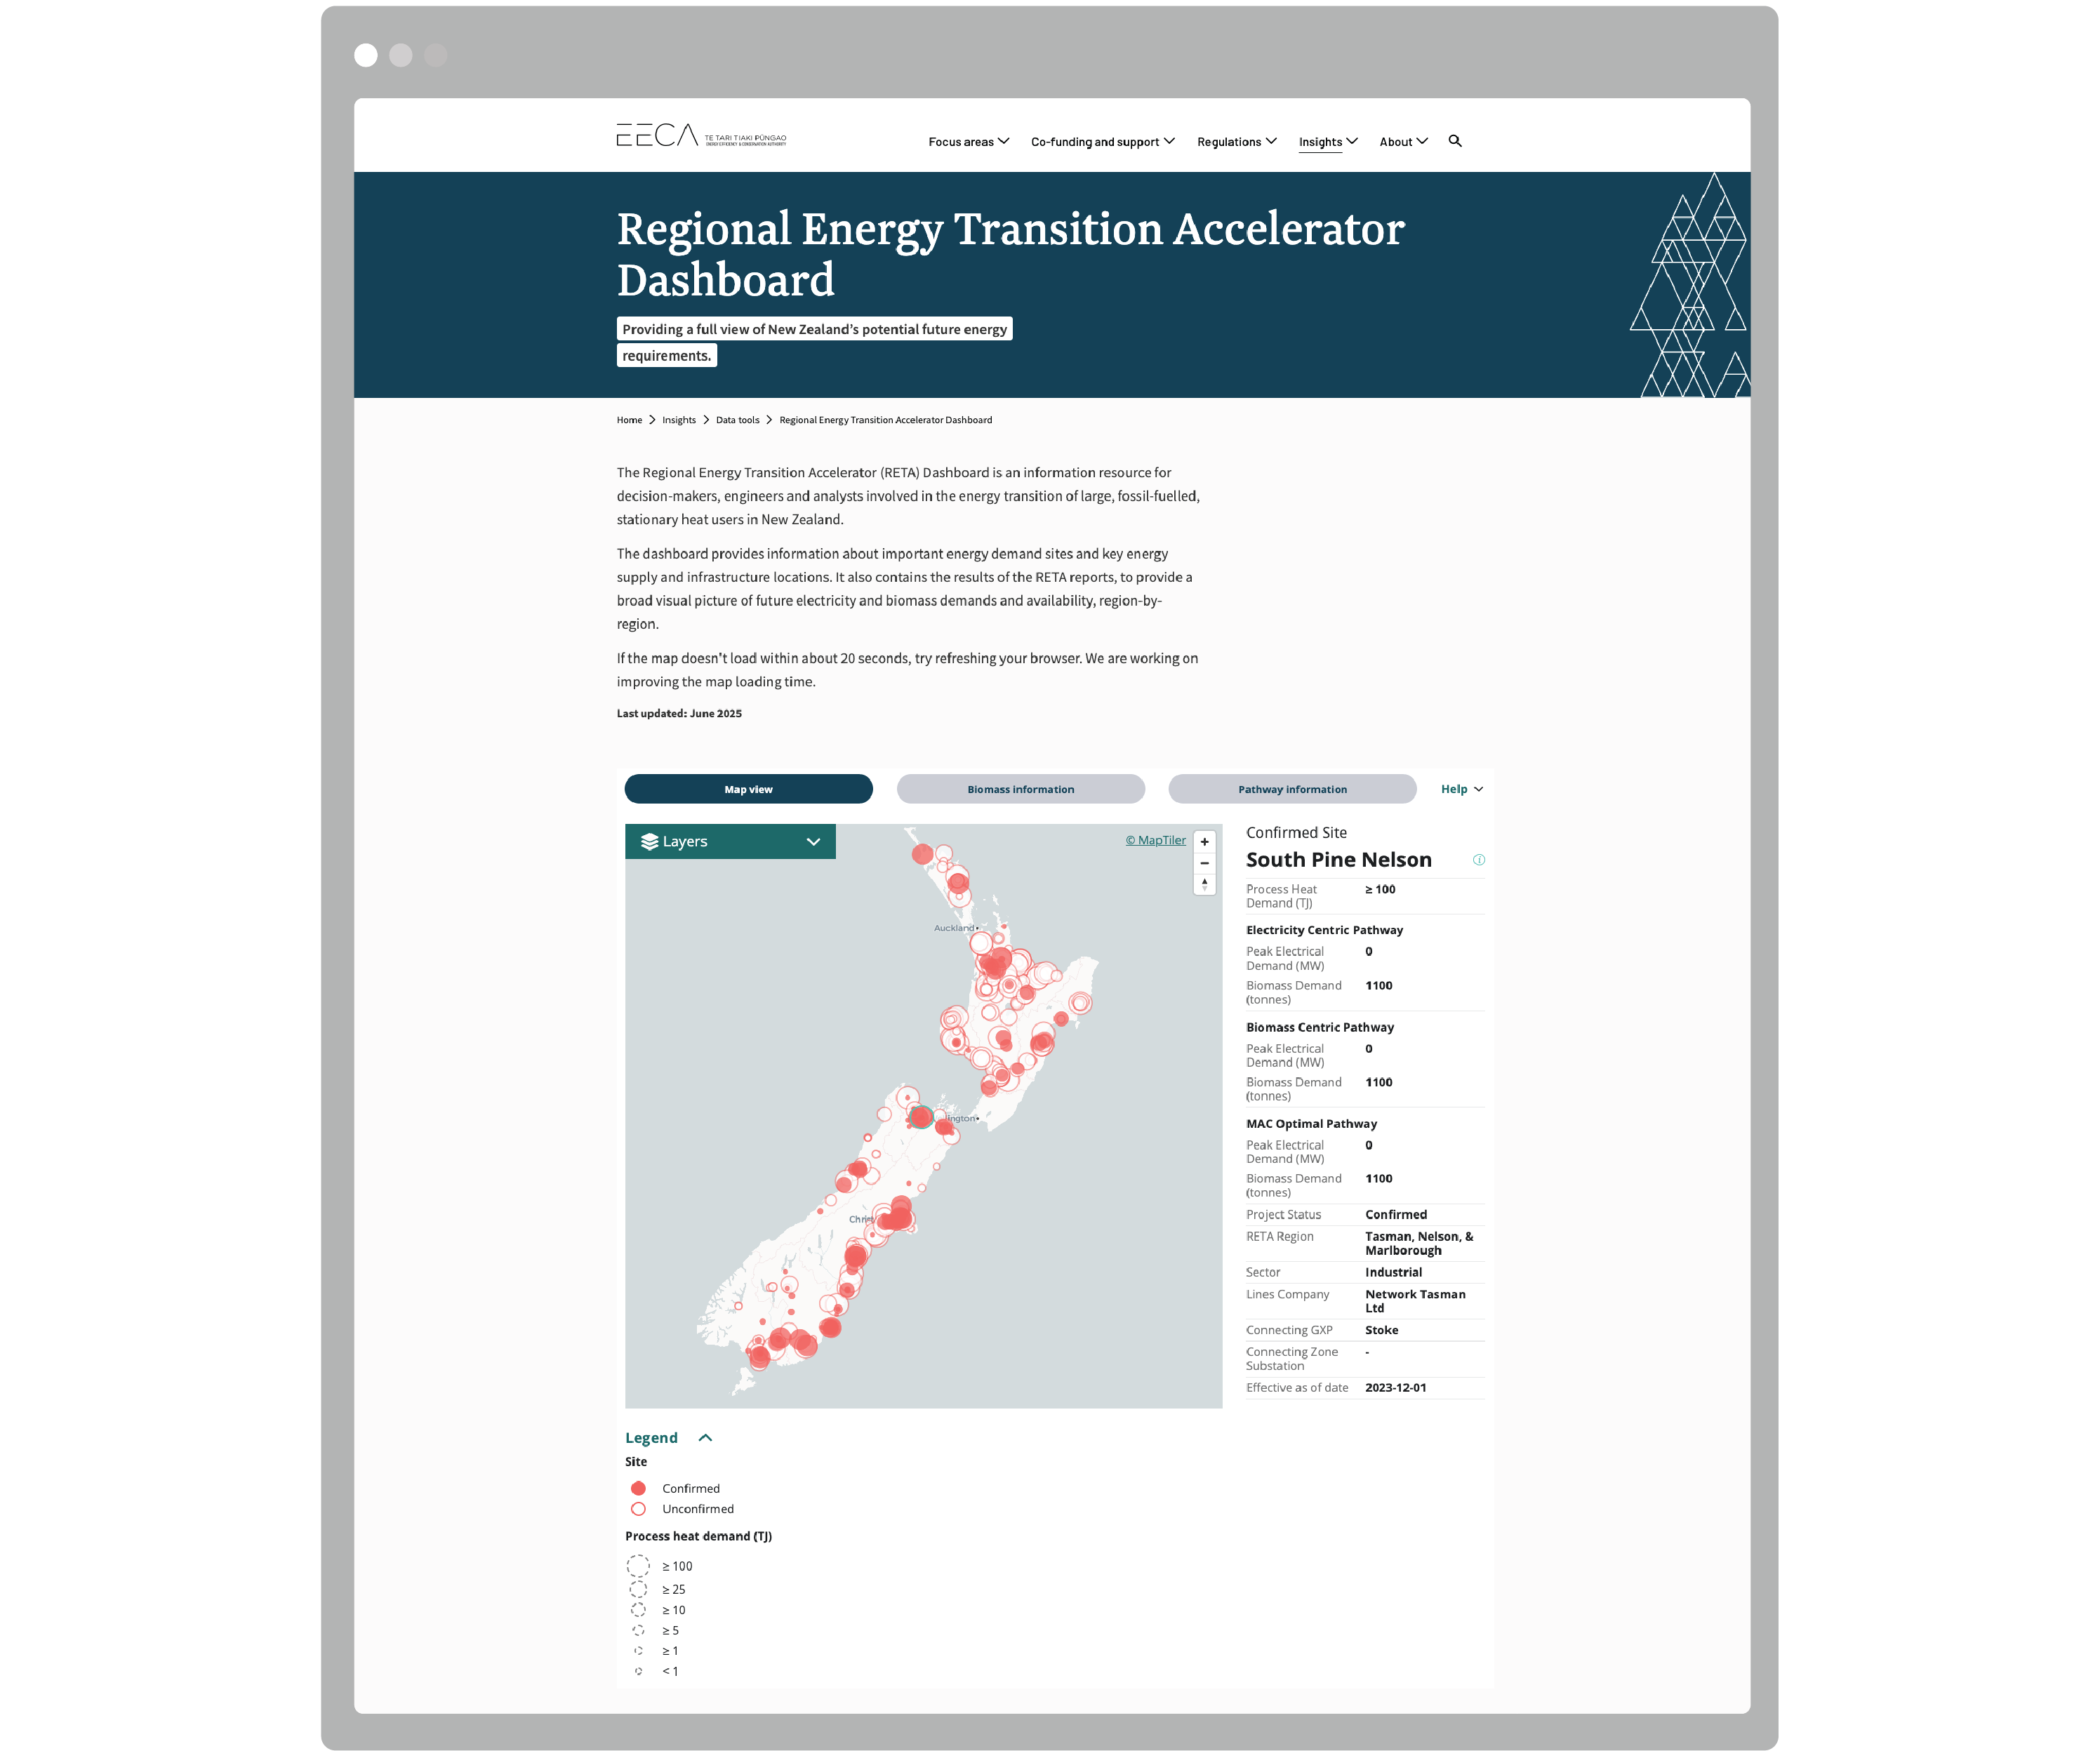
The Regional Energy Transition Accelerator (RETA) Dashboard is an information resource for decision-makers, engineers and analysts involved in the energy transition of large, fossil-fuelled, stationary heat users in New Zealand. The dashboard brings together a wide range of information in a centralised location, providing an effective resource to inform future energy use.
Creating actionable outputs to drive change
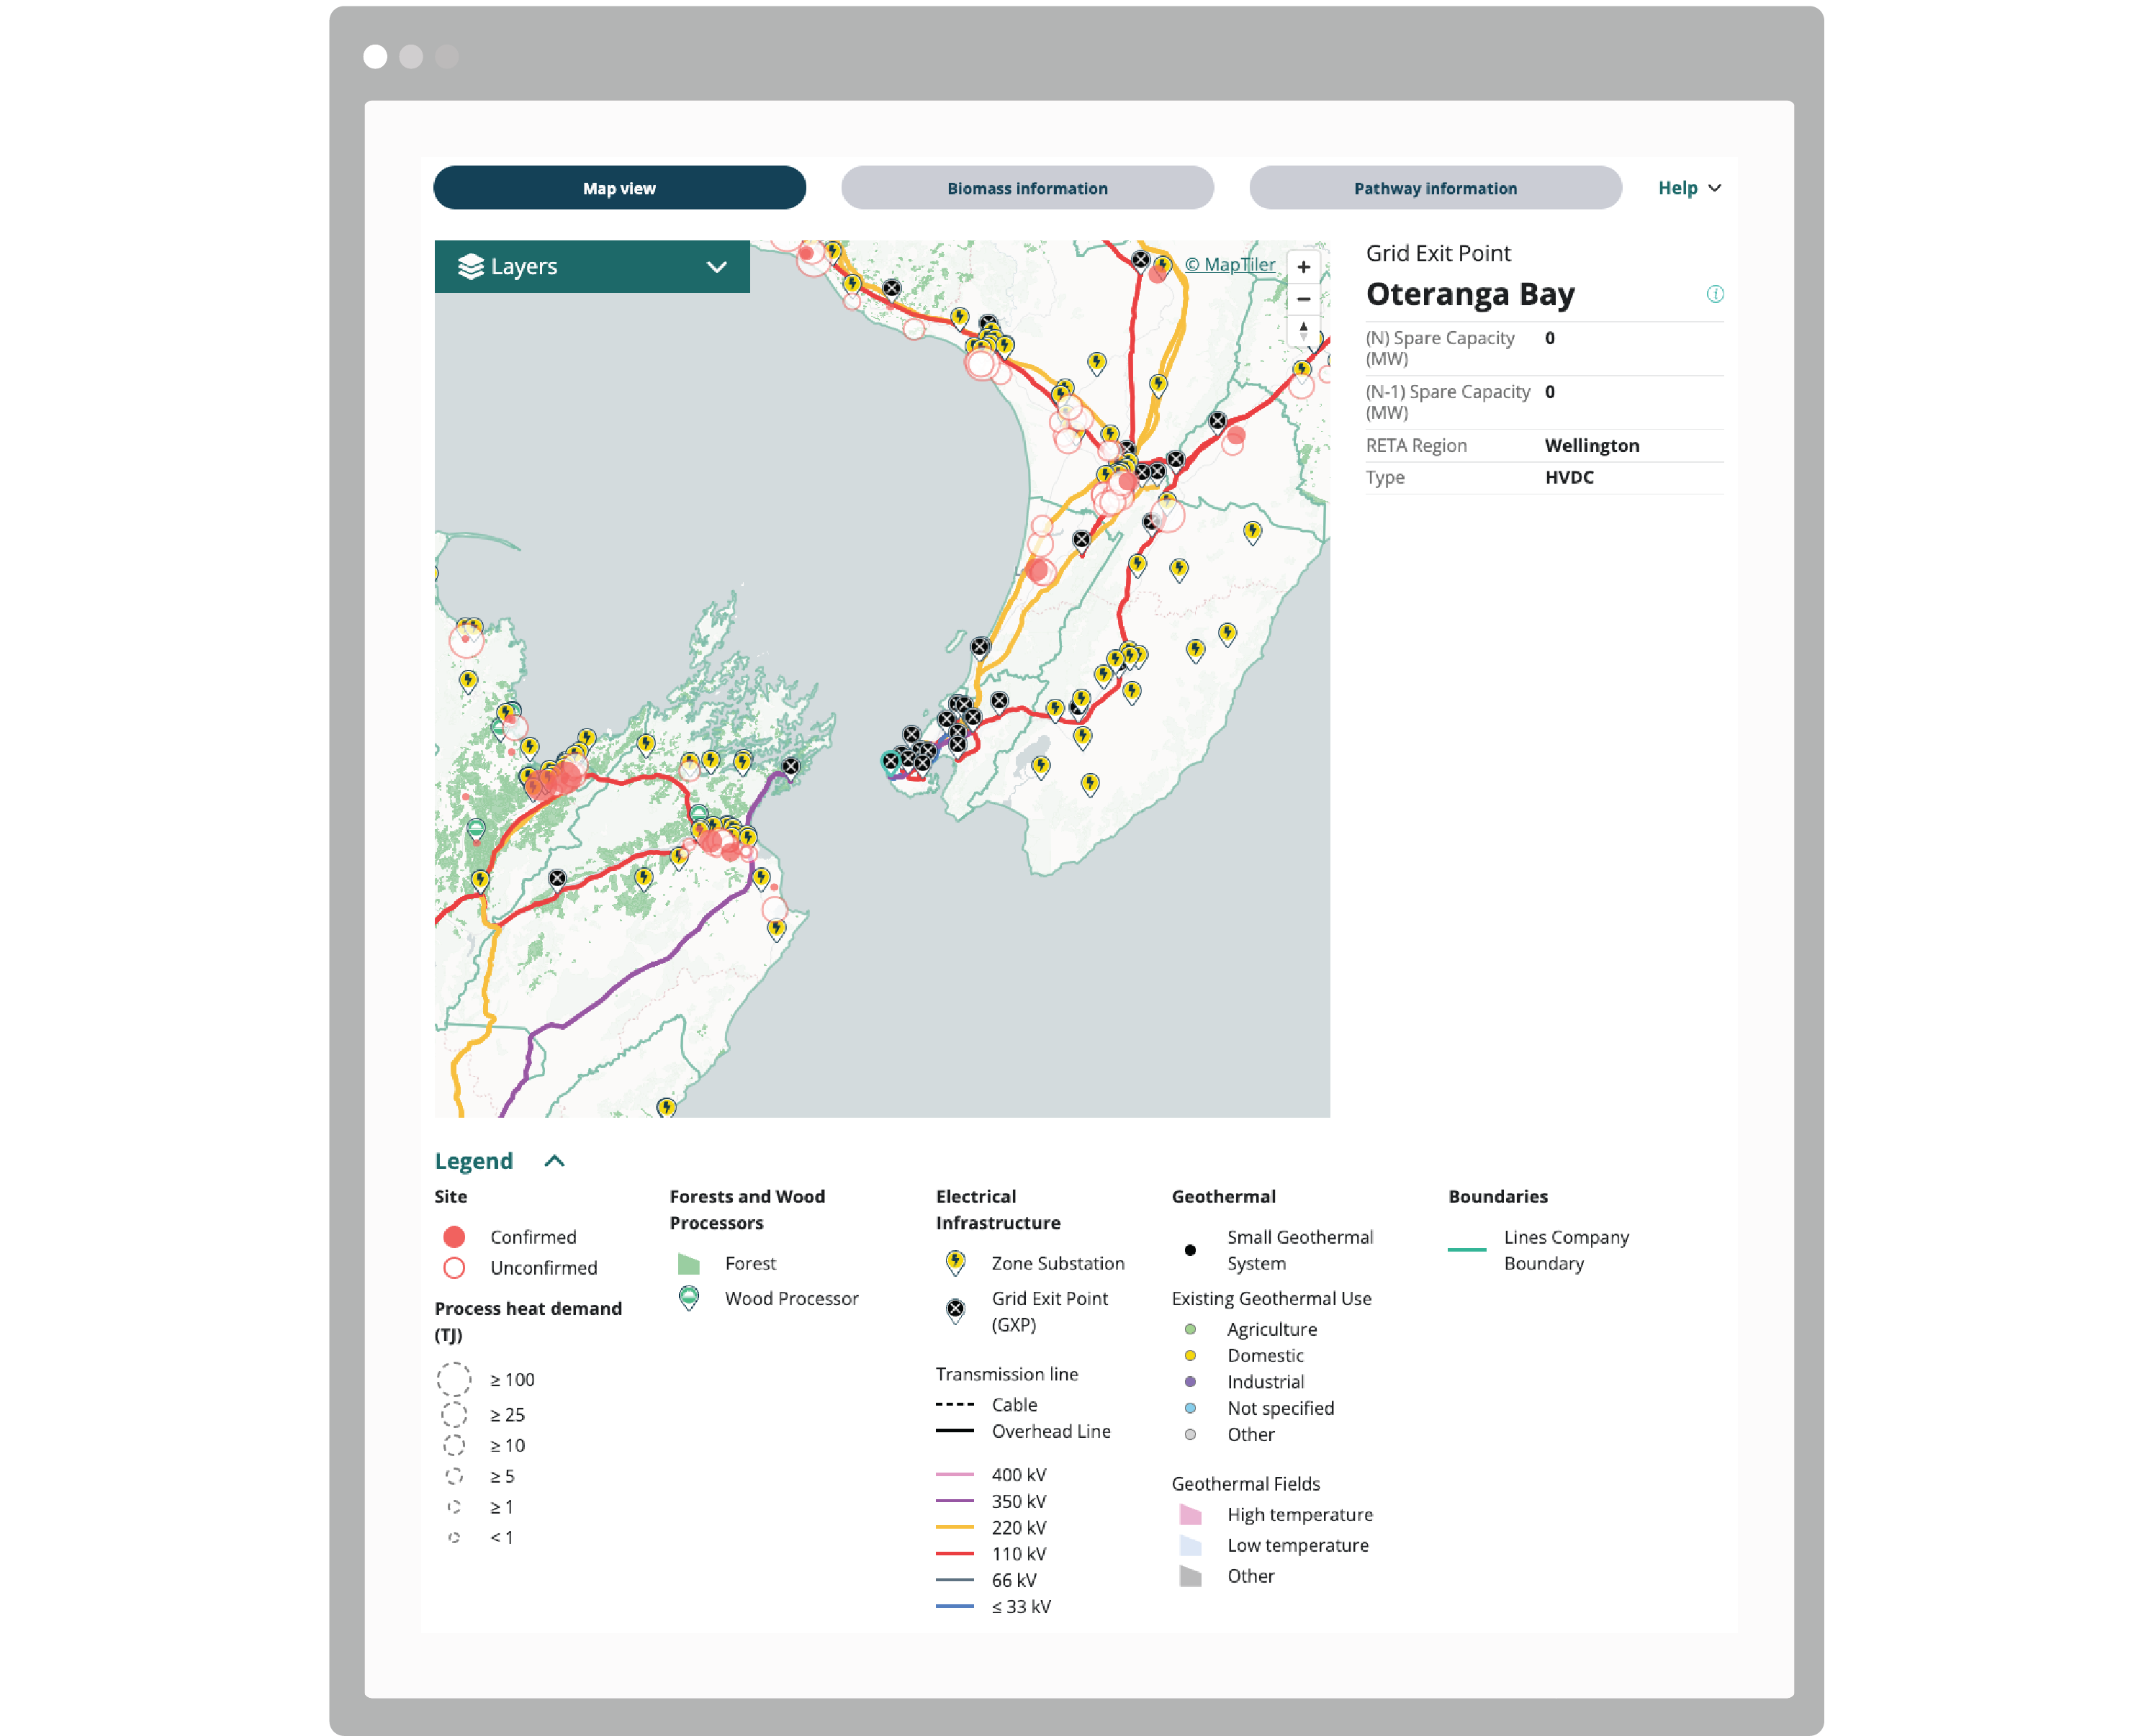
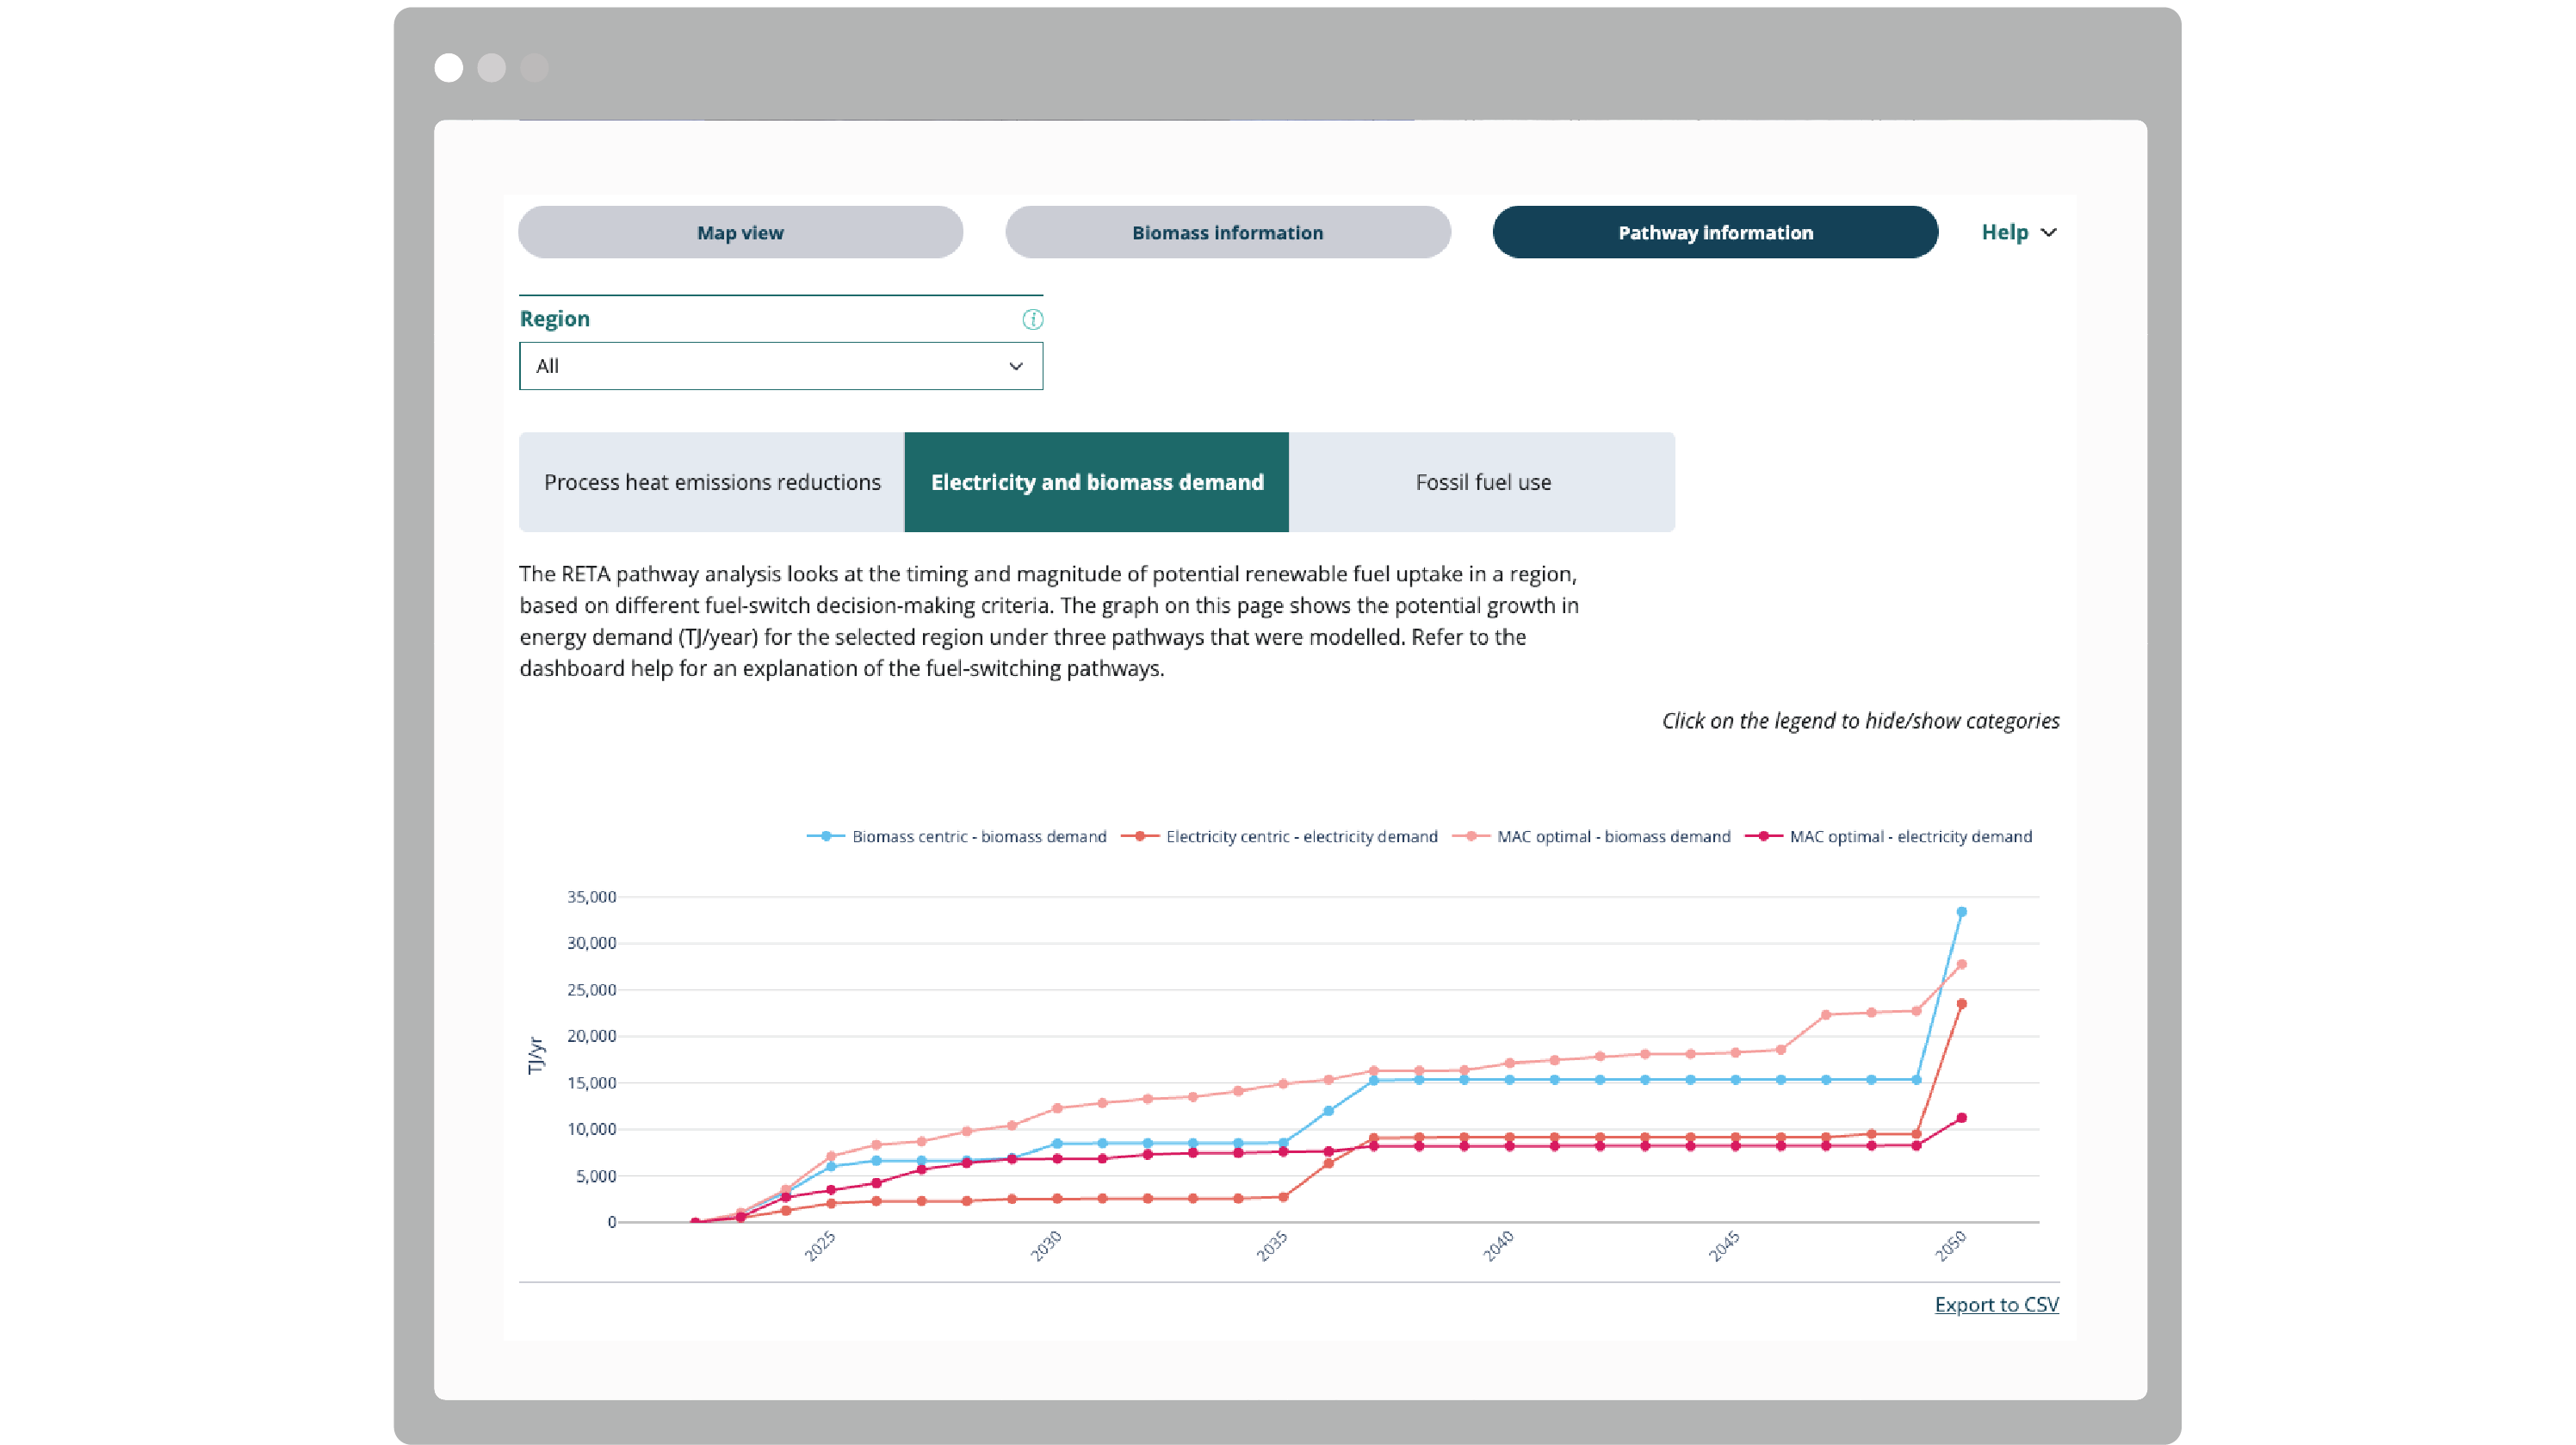
The dashboard unifies information about important energy demand sites, key energy supply and infrastructure locations and renewable supply options into a single resource. Users can visualise practical, commercially relevant pathways to renewable energy alternatives such as electricity, geothermal and biomass. Connecting users with these actionable insights supports the transition to more sustainable energy systems that underpin the wellbeing of current and future generations.

A customised planning tool
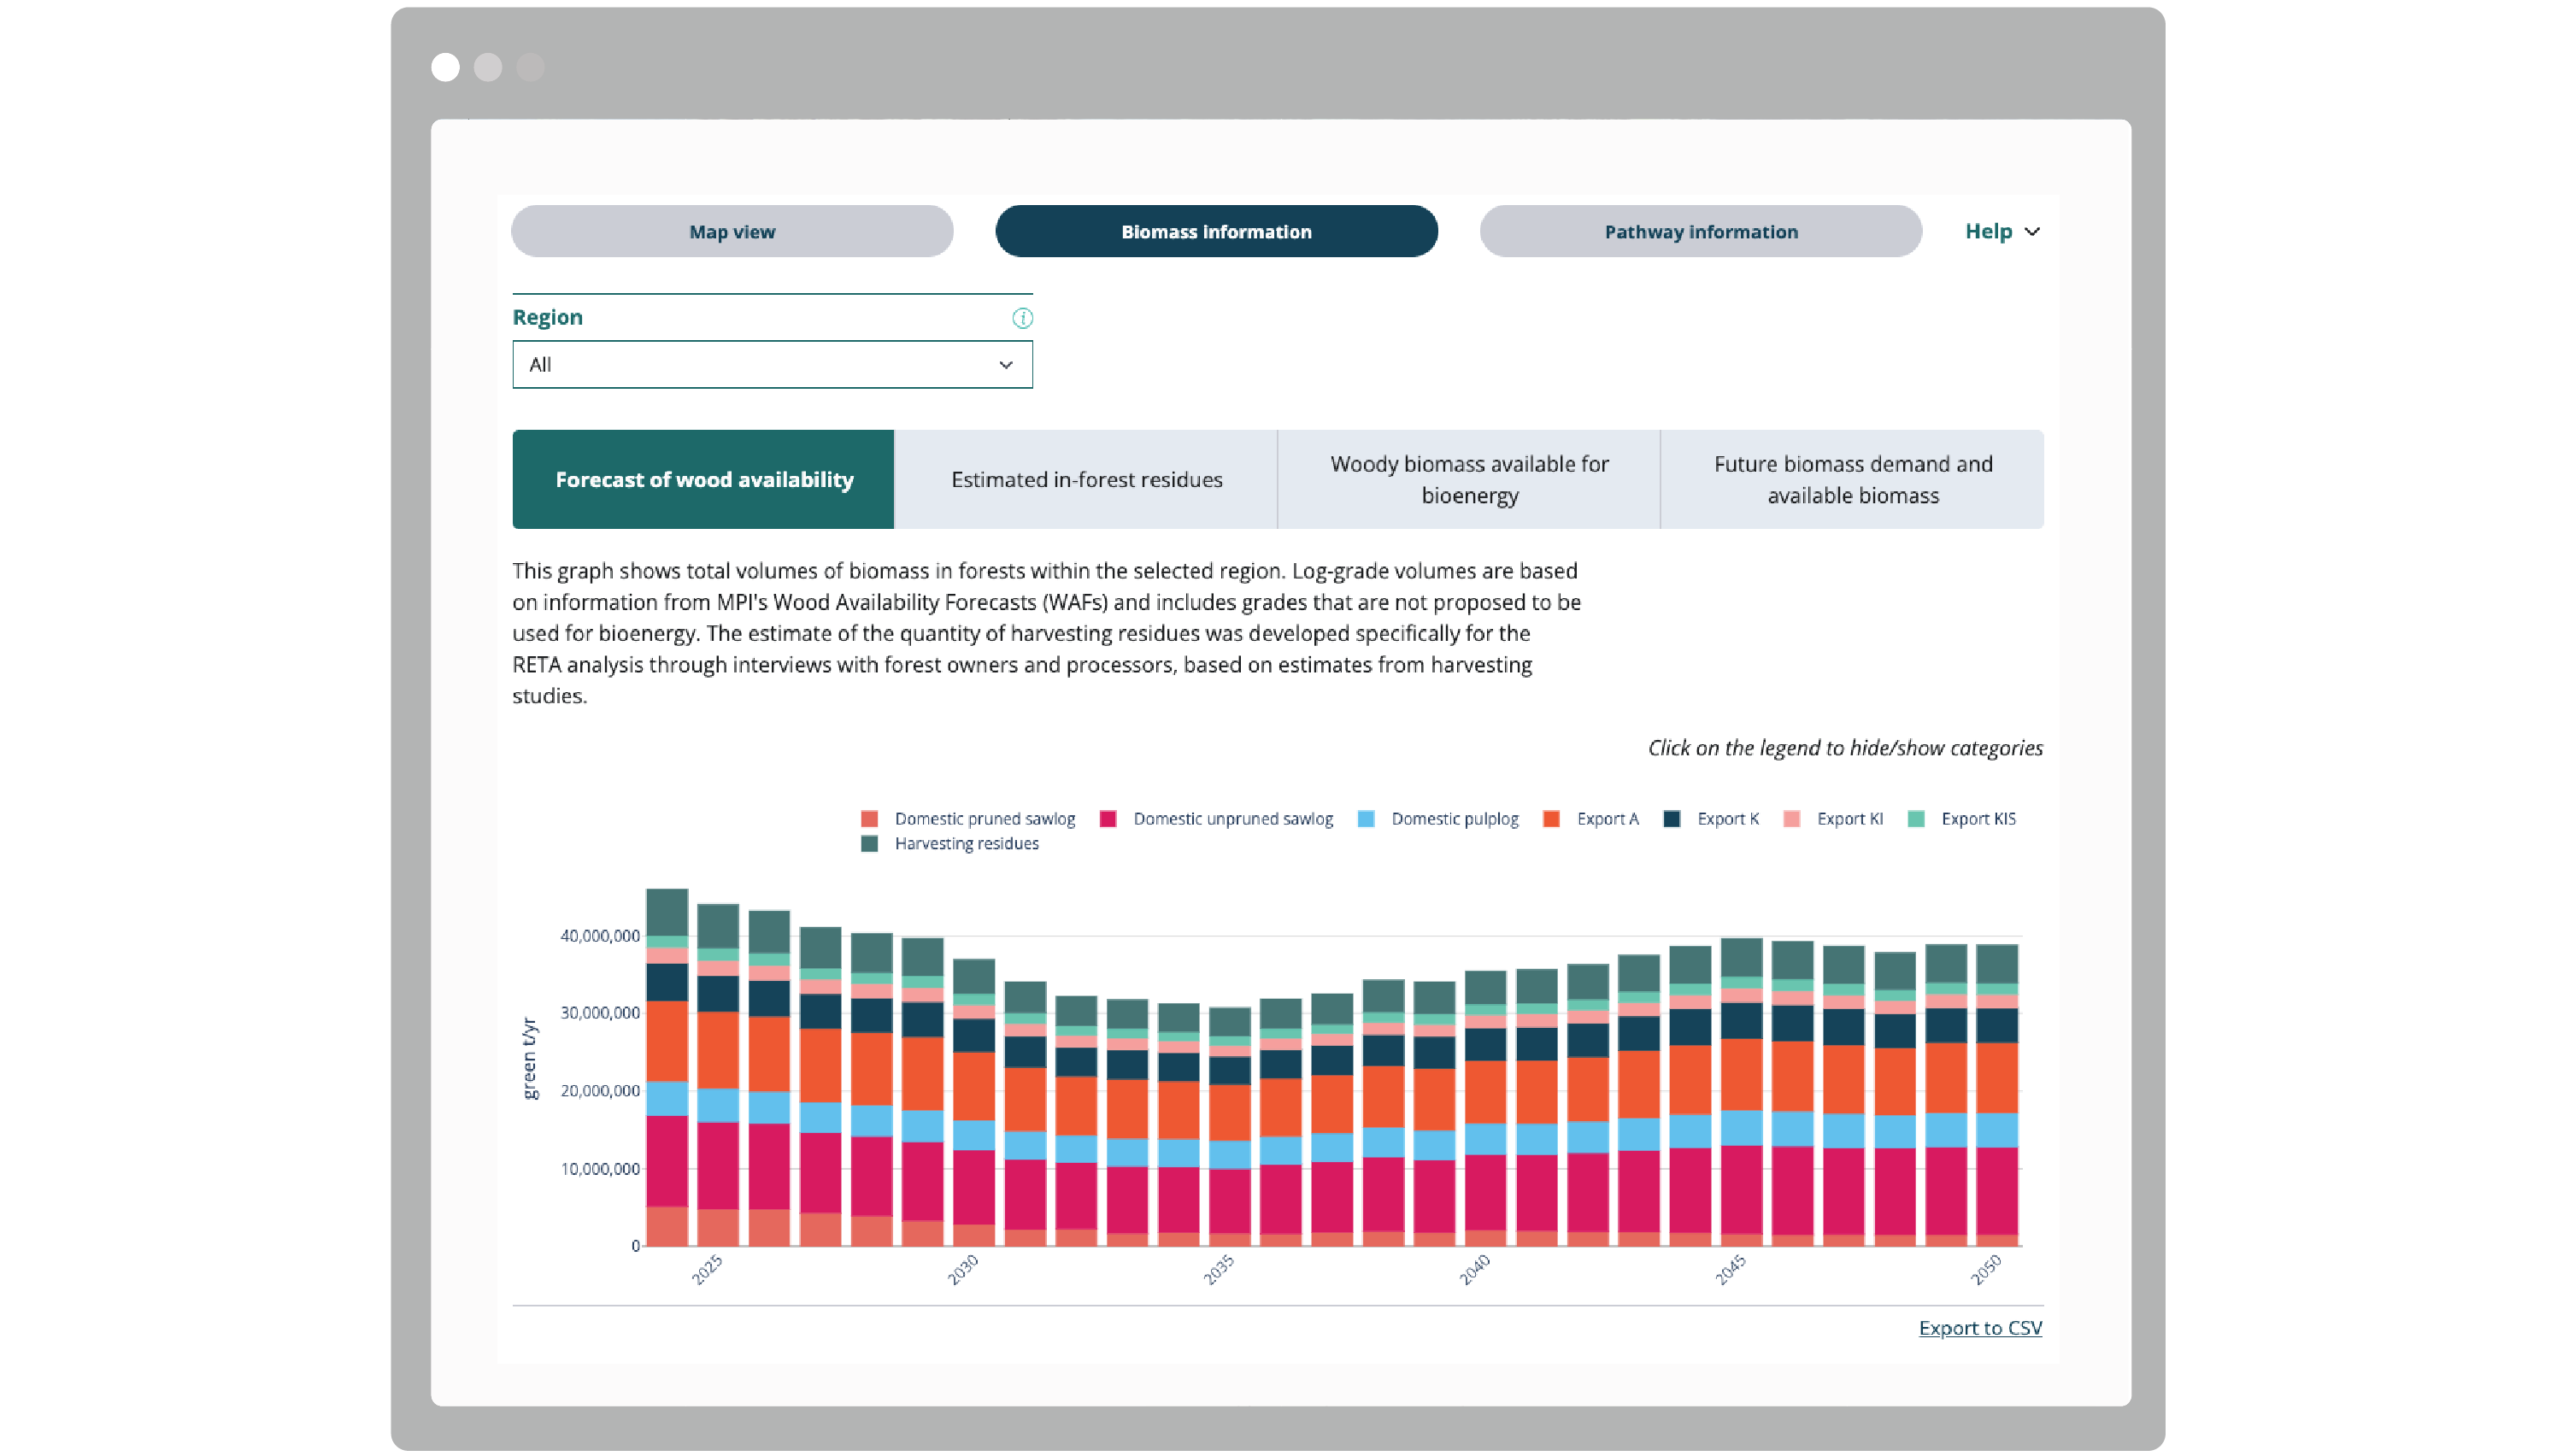
The RETA dashboard supports fossil fuelled stationary heat users in their transition towards sustainable energy sources, providing a platform for users to visualise future electricity and biomass demand and availability on a region-by-region basis.
Multi-layered maps enable highly customised visualisations, so users can explore key data such as summary information of nearby supply and infrastructure locations specific to their own context. The tool also features visualisations of future biomass availability, which can be explored on a regional basis, ensuring energy transitions are not limited by future supply and demand.

Improved accessibility to empower change
The UX design was put through multiple rounds of testing to ensure stakeholder expectations were met and design features fit the practical needs of users. It became clear that it was critical for the visualisations to be intuitive and easily accessible. This was achieved by implementing a mobile responsive layout in the design process. As a result the tool blends seamlessly into the EECA website and can be accessed by users on the go.

Supporting the shift to renewable energy
The openly-available resource connects large energy users with actionable planning tools, informing the uptake of evidence-driven solutions to support a nationwide change in energy use – away from fossil fuels and towards cleaner renewable energy sources.

Built for adaptability and future scale
To support long-term energy planning, we re-engineered the existing dashboard using Shiny for Python (PyShiny) – an open-source Python framework combining reactive interactivity with analytical power. This shift allowed us to streamline complex geospatial visualisations, optimise performance across large datasets, and establish a clear separation between data logic, UI components, and rendering. The underlying architecture is modular and extensible: new datasets, filters, and UI panels can be added with minimal code duplication.
Backed by full-stack data science
To make future iterations easy to build and ensure maintainability we developed reusable PyShiny components and templated coding patterns. The dashboard is powered by a structured data pipeline, enabling routine refreshes and content updates without developer intervention. Automated CI/CD workflows were configured to enable rapid iteration, while aligning with EECA’s testing and code infrastructure requirements. The dashboard itself was then embedded in an iFrame directly into the EECA website to enable easy access and contextual information for key stakeholders.