Connecting eDNA data with everyday decision-making to improve biodiversity, biosecurity and water quality
Environmental DNA (eDNA) is taking the world by storm as a powerful tool to manage ecosystem health. However, the data generated is highly complex and not easy to digest. There is a need for user-friendly data science tools and interfaces for exploring and sharing eDNA data, including information on species diversity, abundance, and distribution. This will inform decision-making and management efforts and to support ongoing research and monitoring activities.
We would like to thank the following organisations for their collaboration, data, insights and support:
Minderoo Foundation, Hawke’s Bay Regional Council, Wilderlab
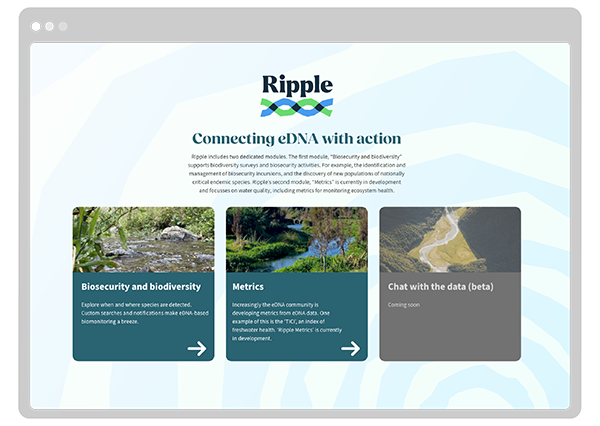
Connecting eDNA with action
The Ripple eDNA Dashboard is a visualisation, collaboration and reporting tool to help users make the most out of your eDNA data. Ripple creates a bridge between the powerful data collected and its practical use – managing biosecurity risks, monitoring the state of the environment and exploring biodiversity.
Designed to be accessible to a wide range of users, it is being used by researchers, conservationists, and policymakers. A sophisticated user authentication and dataset permission system provides secure access to public and private eDNA data.
A tool that fits the needs of a highly specialised user community
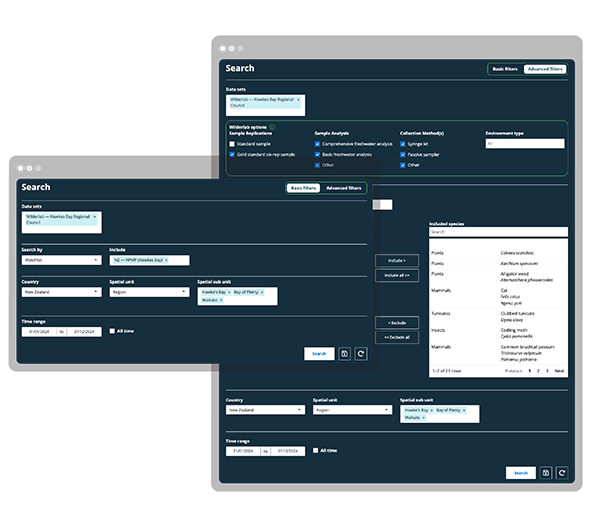
Unifying results from multiple laboratories provides the eDNA community with a tool that support collaboration and data sharing. Users can perform large and complex searches covering thousands of species detections within a single sample alone linking with complex taxonomic classification.
Ripple’s notification and alert features allows its user to manage a large number of species of interest and keep oversight of recent detections.

Diverse functionality for diverse needs
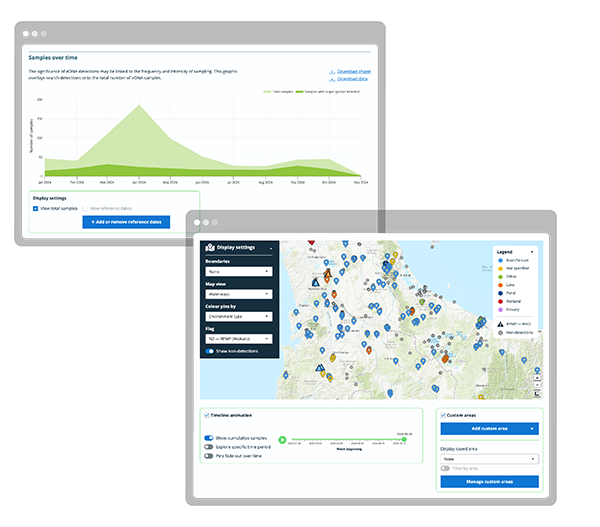
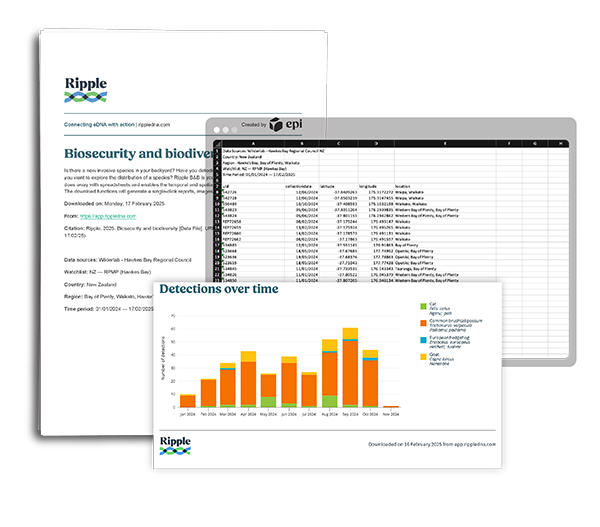
The dashboard provides a user-friendly interface for exploring and sharing eDNA data, including information on species diversity, abundance, and distribution. A plethora of custom features allows users to filter and search data in space and time to identify patterns and trends and generate downloadable custom outputs such as reports, data sets or graphs.
Creating a high-performing app
To create Ripple we had to combine different data science tools including for example an interface built with R Shiny, JavaScript and CSS and a PostgreSQL relational database to store application metadata. The app is hosted on EPI’s own autoscaling hosting environment to ensure it operates in a secure and stable way at all times.